By Kevin Collins, Alex Dawahare, Oscar Castorena, and Alejandro Frydman
Survey 160’s final poll of 2026 focused on four states with elections for both United States Senate and Governor: Kansas, Ohio, Maine, and Minnesota. Across this range of states, we found the Democratic candidates leading in races for Senate and Governor in each of the four states, albeit by varying margins and some (such as Maine) within the margin of error.
In order to address known concerns about coverage limitations of text-only surveys, this registration-based sample probability survey used multi-modal fielding, augmenting Survey 160’s text survey methods with traditional IVR and AI interviewers to call landlines. However, while the texting yielded ample number of interviews, both approaches to automated calls to landlines struggled, which (when using phone type as a weighting factor, as we did in this analysis) produced larger than ideal design effects (and correspondingly smaller than desired effective sample sizes).
Kansas
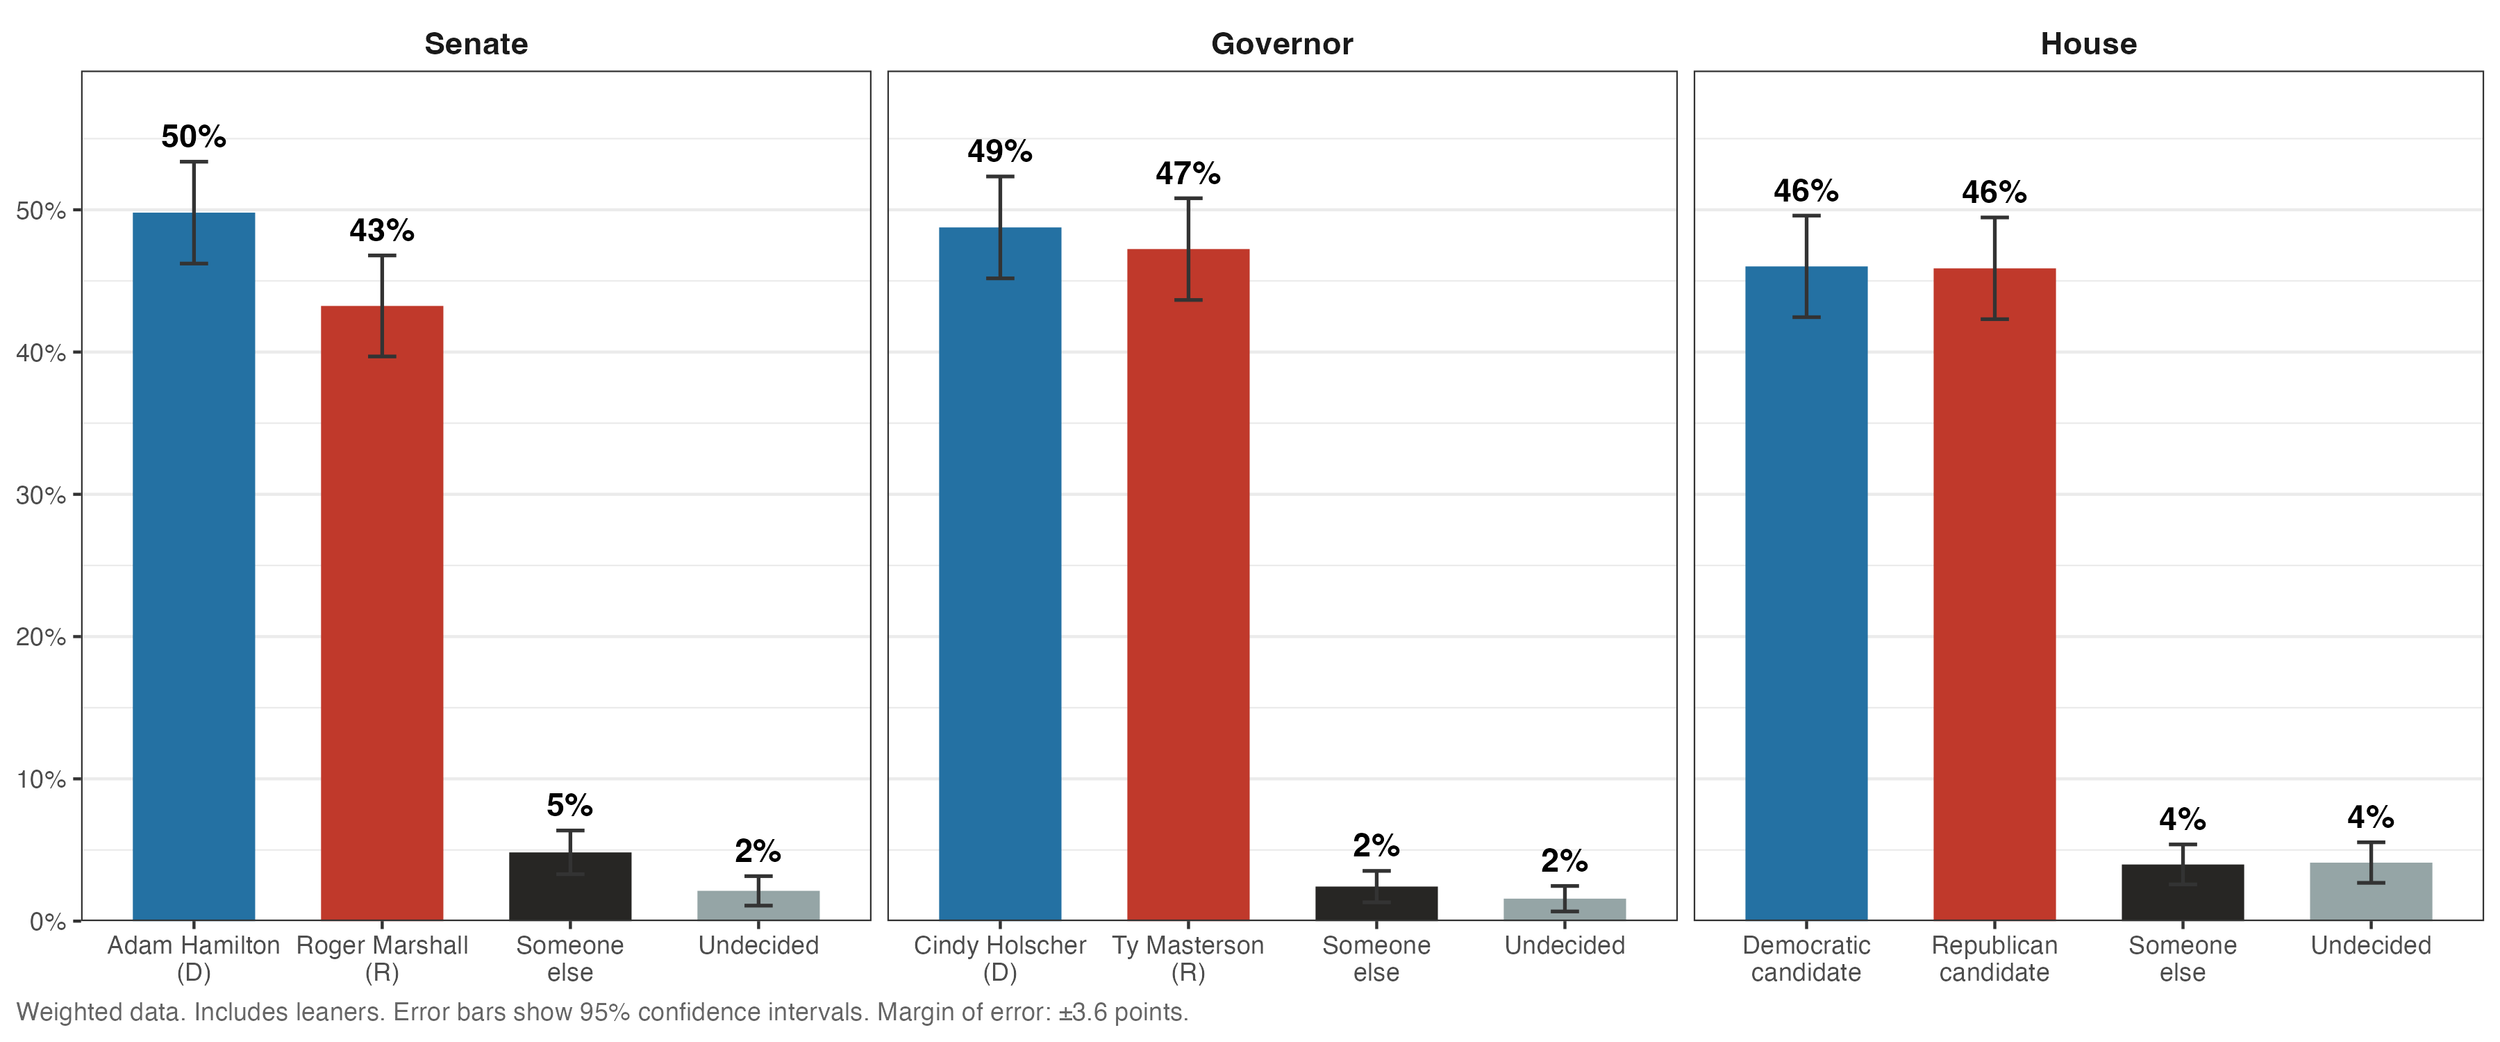
In Kansas, we find Adam Hamilton (D) leading incumbent Roger Marshall (R) in the race for US Senate by 7 percentage points, and Cindy Holscher (D) leading Ty Masterson (R) in the contest for Governor by 2 percentage points. Democrats and Republicans are tied in the generic US House ballot, both at 46%.
Ohio
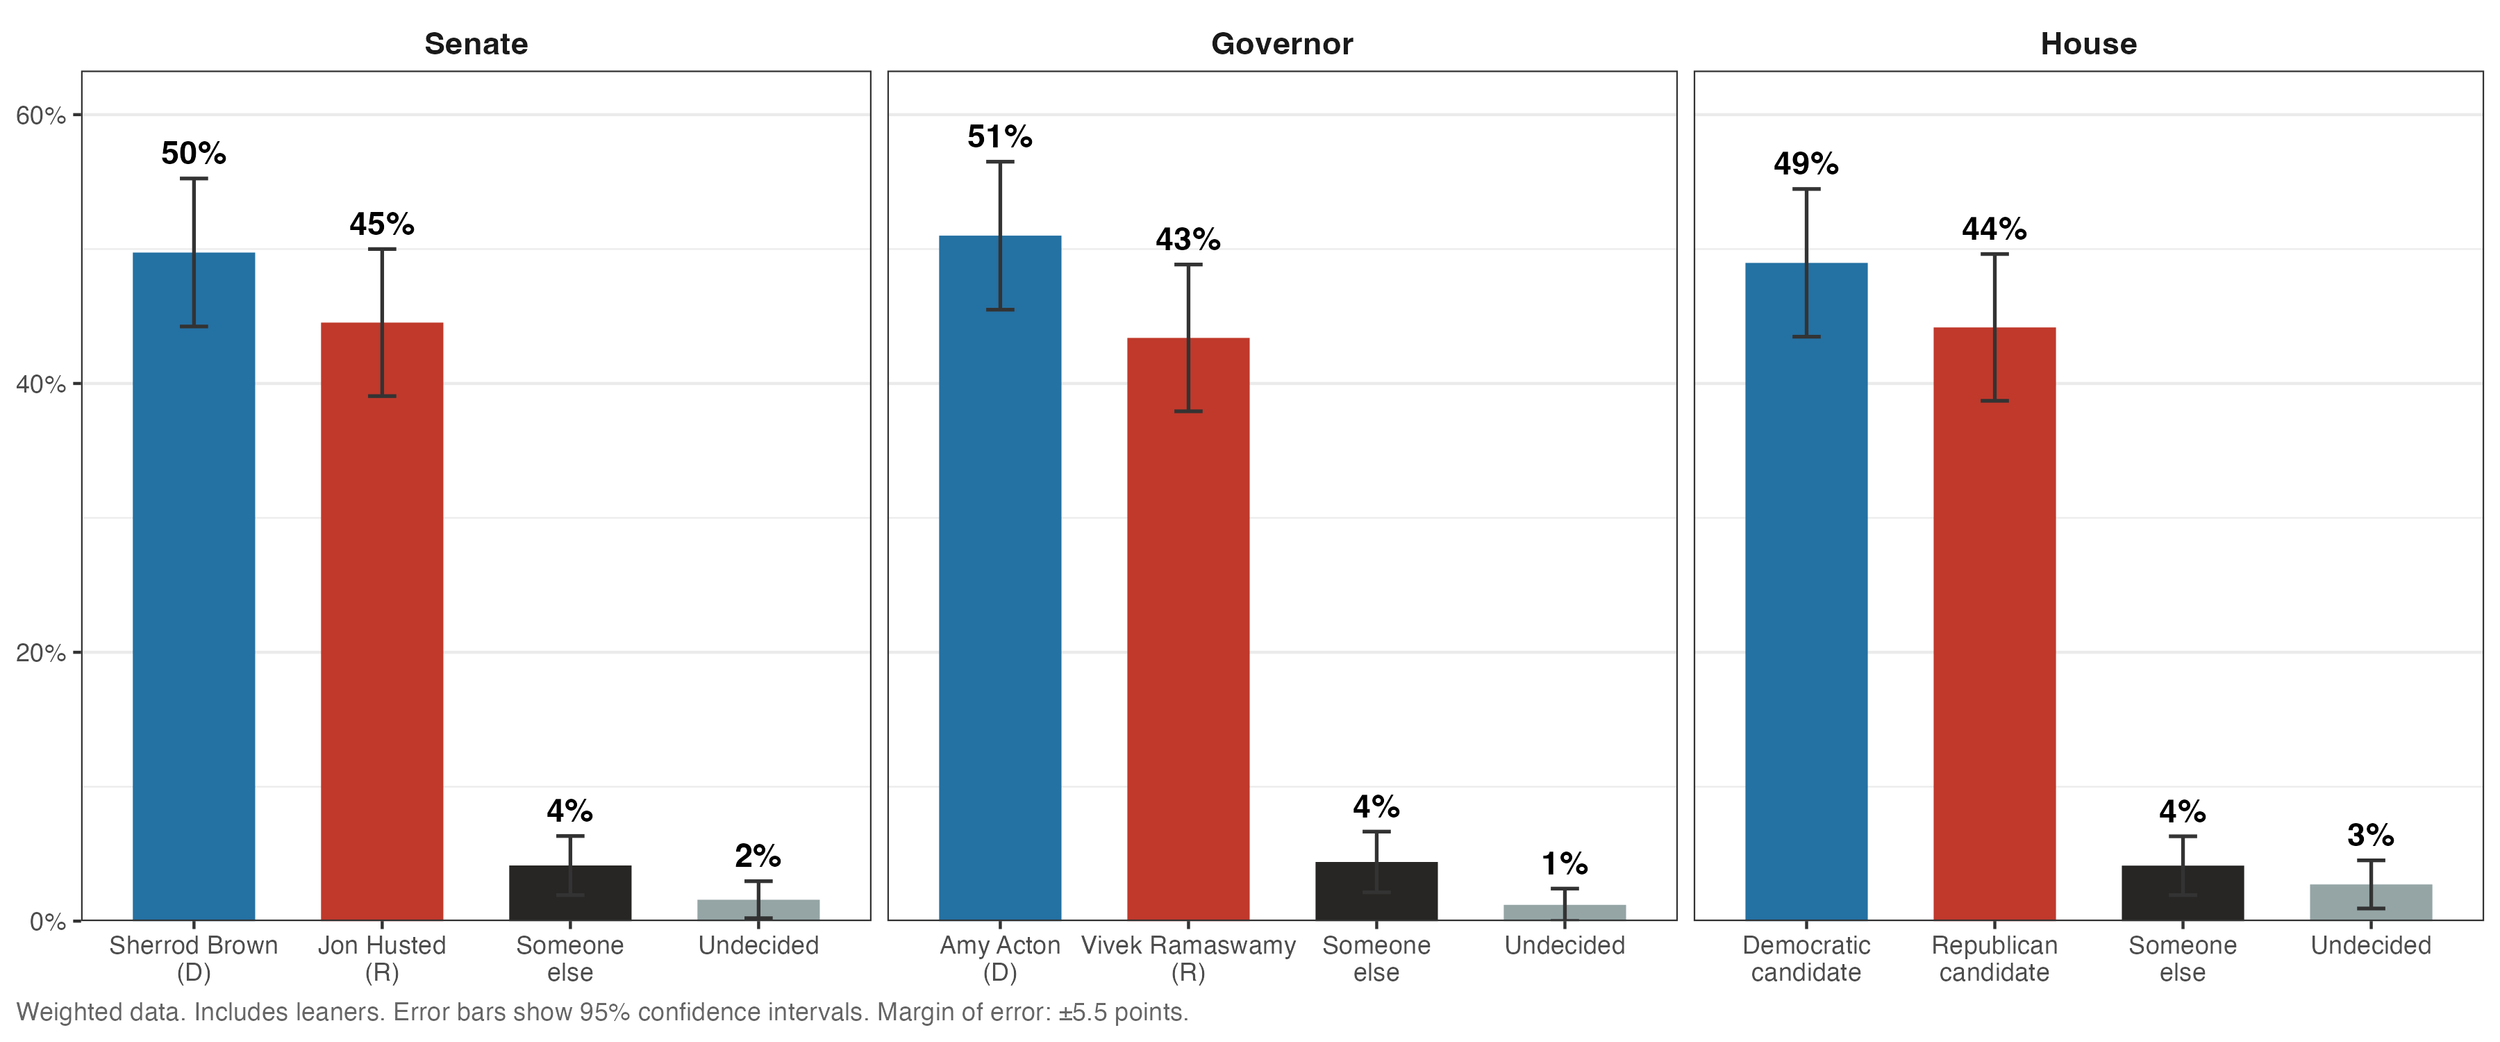
In Ohio, we find Sherrod Brown (D) leading incumbent John Husted (R) in the race for US Senate by 5 percentage points, and Amy Acton (D) leading Vivek Ramaswamy (R) in the contest for Governor by 8 percentage points. Democrats lead Republicans in the generic US House ballot by 5 points. We note, however, that the design effect from including landlines as a weighting factor in Ohio was particularly large given the paucity of responses from landlines in particular.
Maine
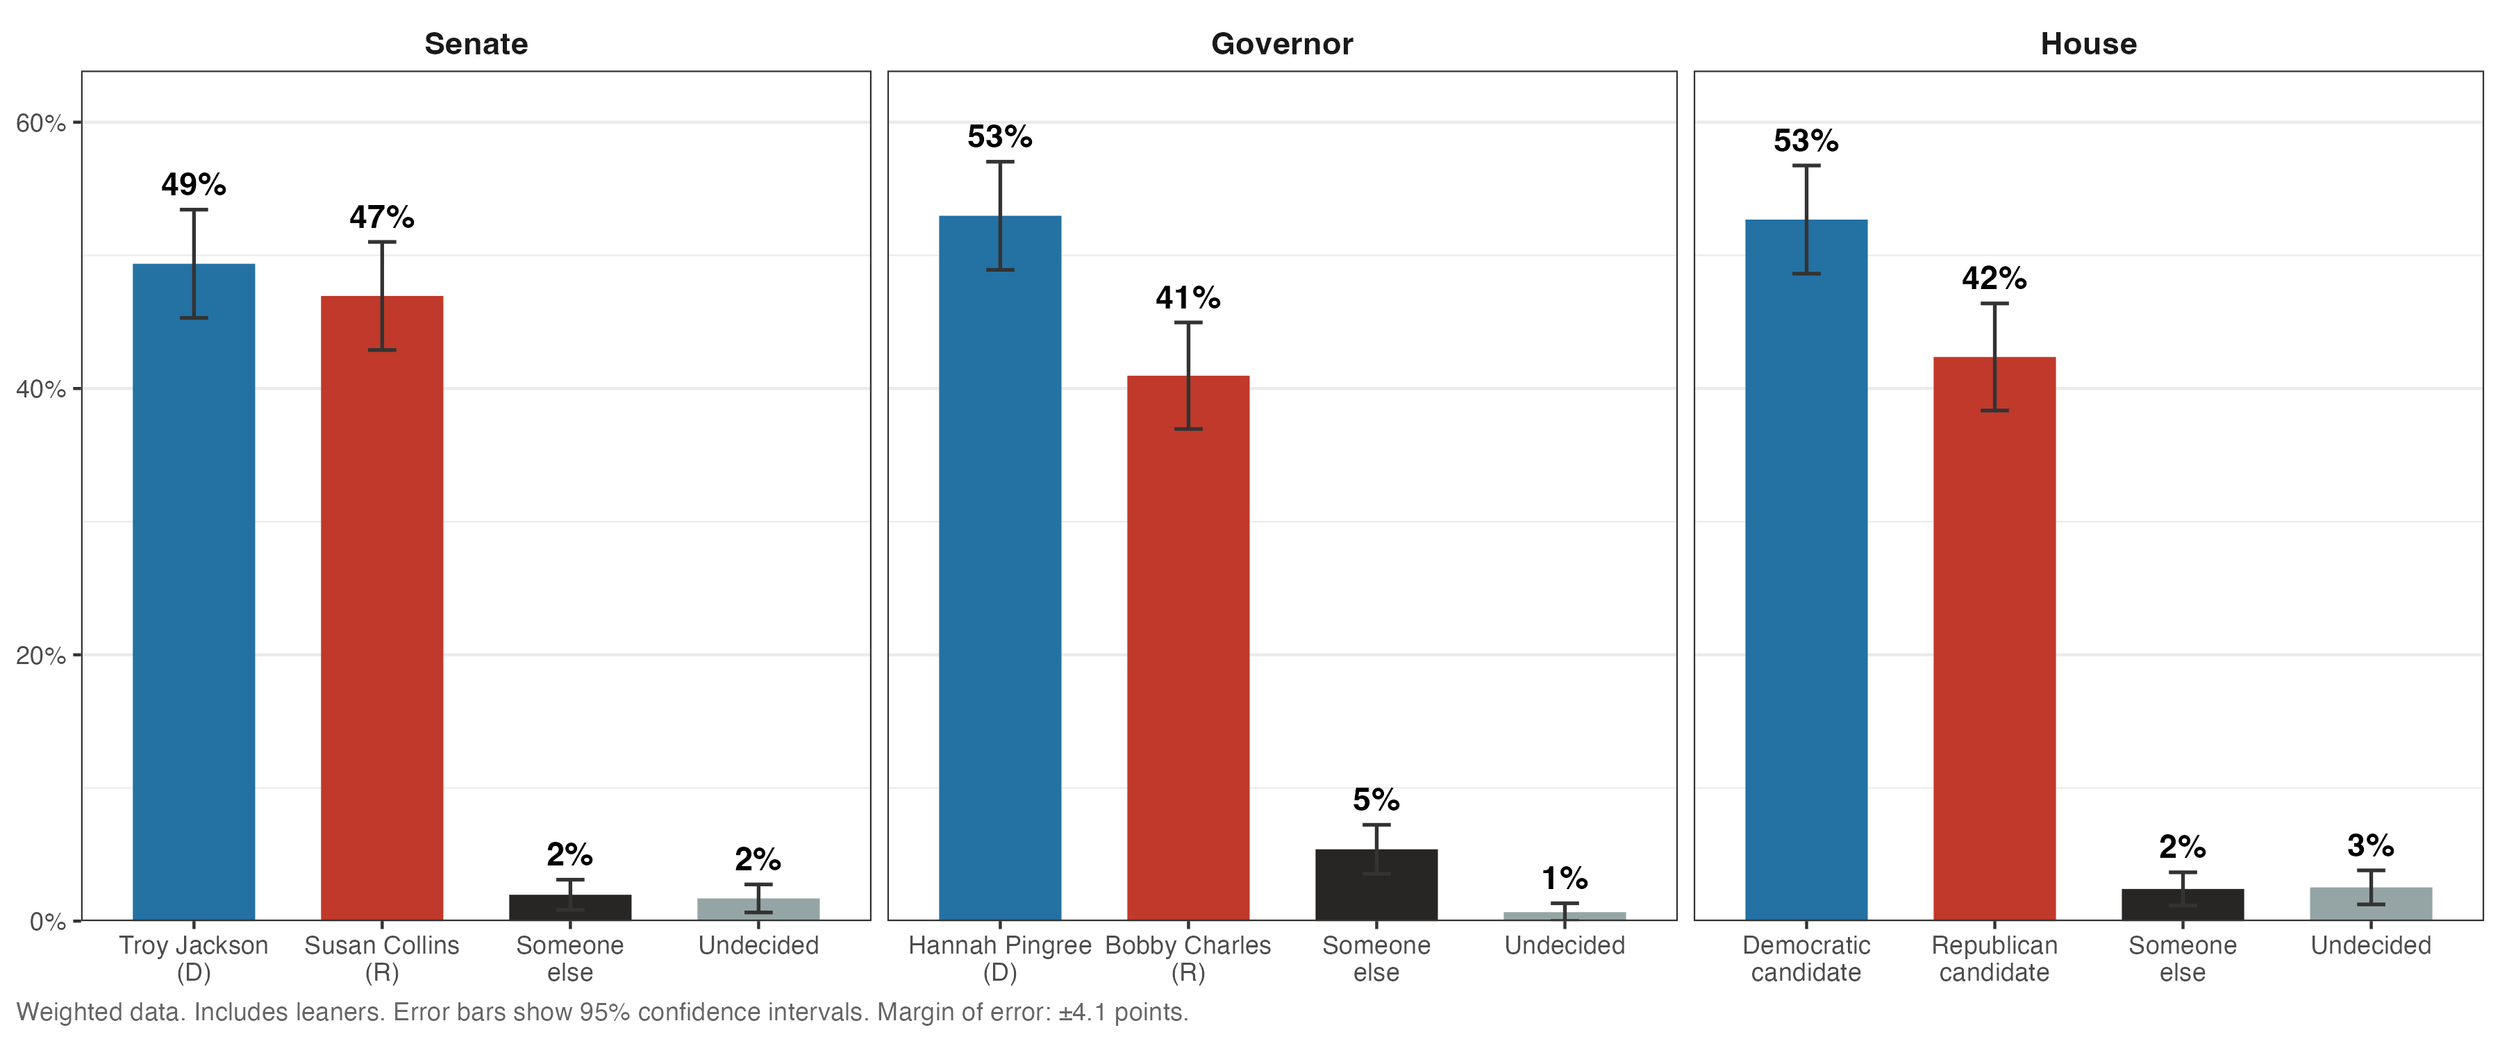
In Maine, we find Troy Jackson (D) leading incumbent Susan Collins (R) in the race for US Senate by 2 percentage points, and Hannah Pingree (D) leading Bobby Charles (R) in the contest for Governor by 12 percentage points. Democrats lead Republicans in the generic US House ballot by 10 points.
Minnesota
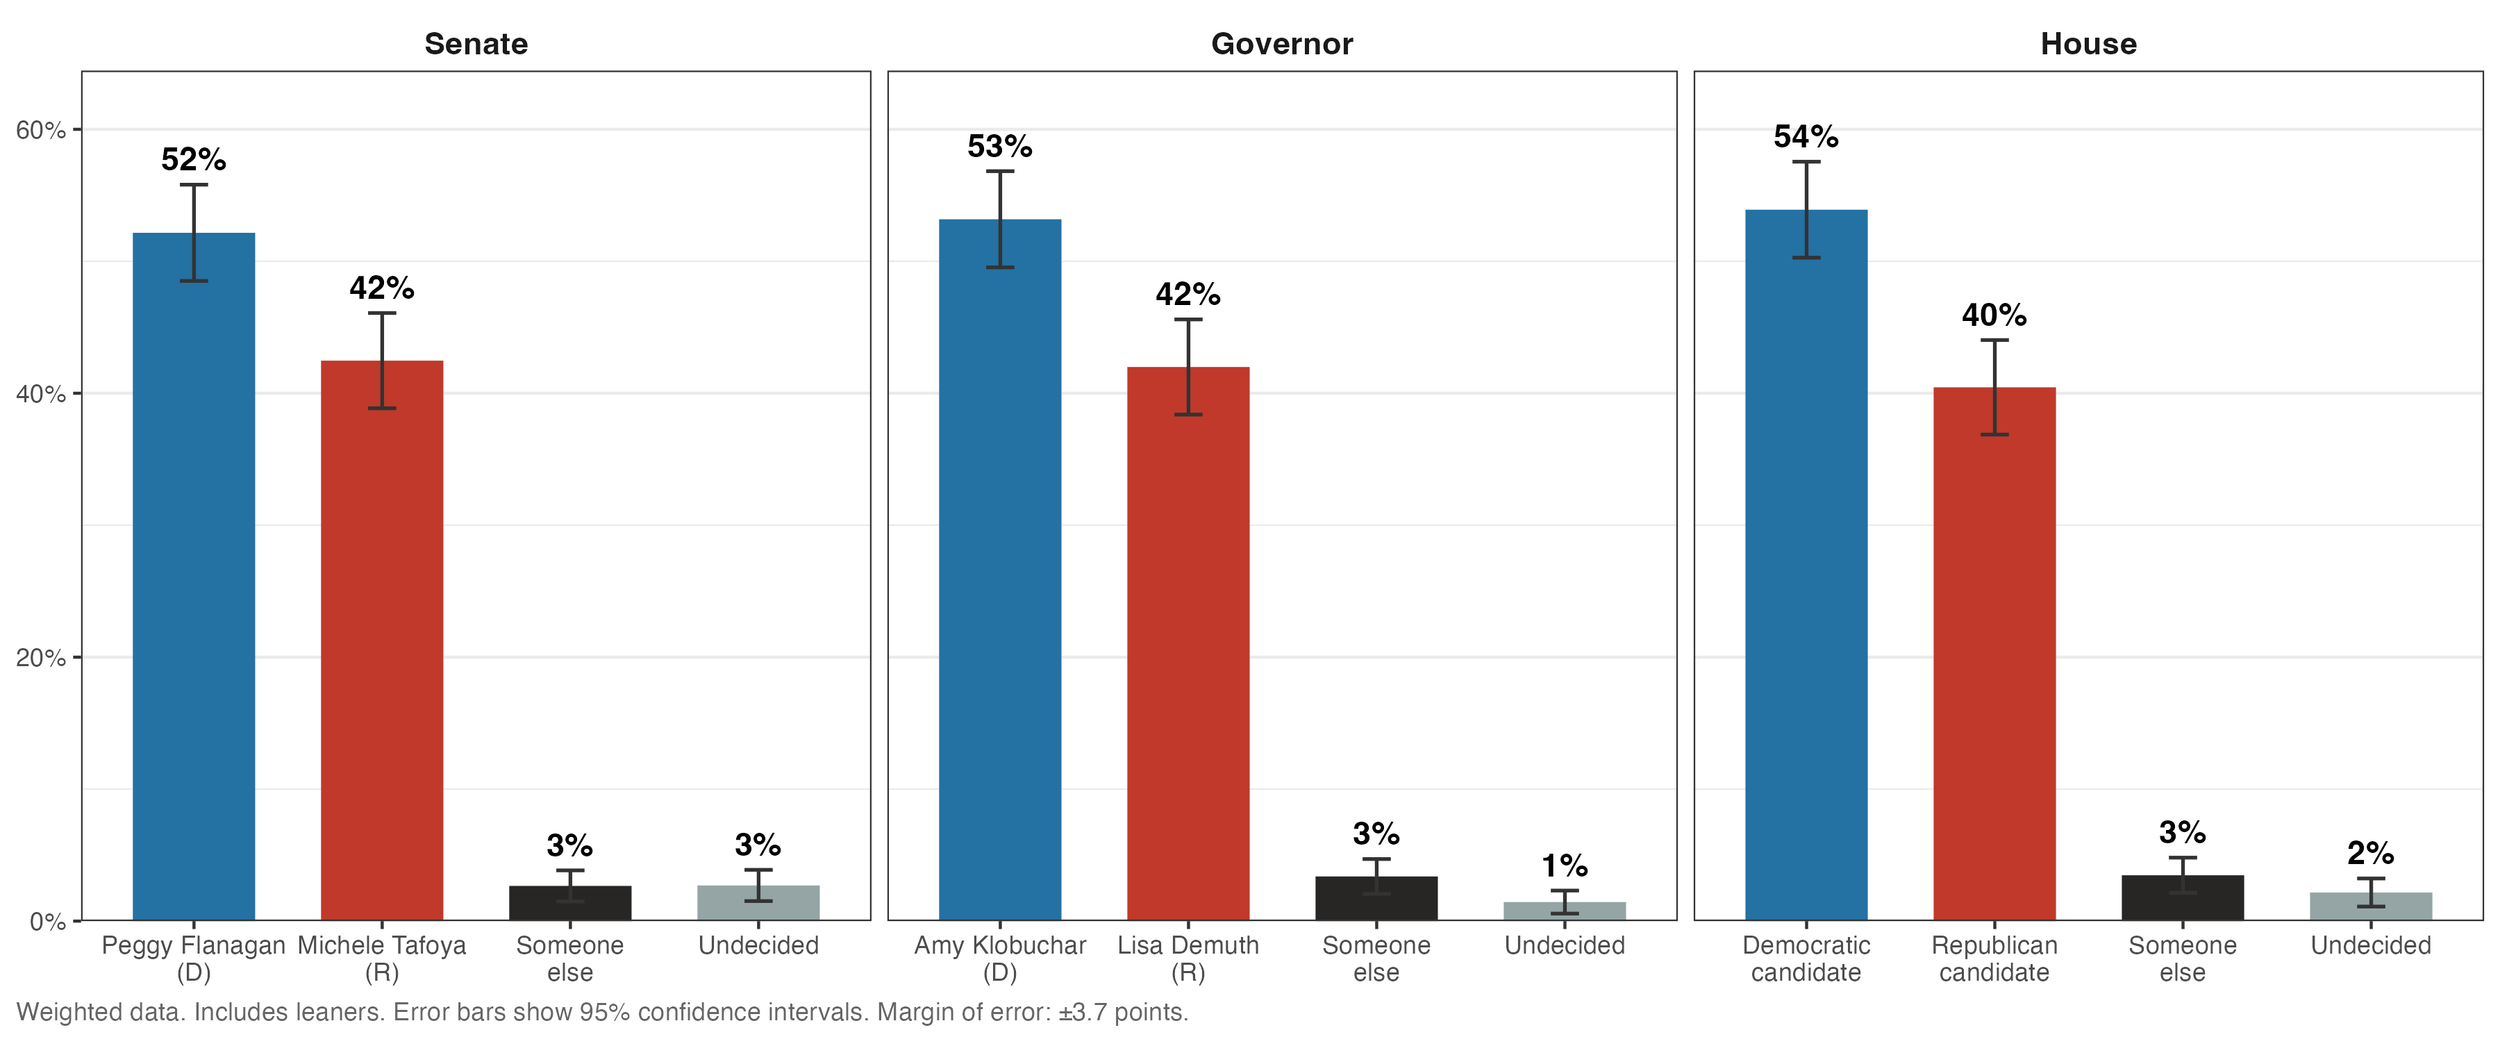
In Minnesota, we find Peggy Flanagan (D) leading Michele Tafoya (R) in the race for US Senate by 10 percentage points, and Amy Klobuchar (D) leading Lisa Demuth (R) in the contest for Governor by 11 percentage points. Democrats lead Republicans in the generic US House ballot by 13 points (the difference from the graph here is the result of rounding).
Full results and crosstabs
Full results, and crosstabs, are below. PDF versions:
Weighting: Raked to sampling stratum, education, region, recalled 2024 presidential vote, whether the respondent has already voted in 2026, and phone type. Rescaled to mean 1 (untrimmed). n = 1353, design effect = 1.78, margin of error = ±3.6 points
SEN. U.S. Senate ballot
Total
Likely voters
Gender
Age
Race
Education
Party registration
Party ID
2024 Vote
Region
Response
Total
Likely voters
Men
Women
18-29
30-44
45-64
65+
White
Black
Hispanic
Other
College
No college
Democrat
Republican
Non-Partisan/Other
Democrat
Republican
Independent/Other
Harris
Trump
Other
Did not vote
Kansas City & Kaw Valley
Rural Kansas
Wichita Metro
Unweighted n
1339
1267
721
604
189
283
437
430
1102
47
70
120
667
672
490
540
309
406
405
528
627
482
59
171
562
461
316
Adam Hamilton (D)
49%
50%
47%
52%
74%
58%
47%
35%
48%
60%
80%
38%
61%
42%
85%
20%
61%
97%
8%
62%
95%
7%
66%
72%
59%
36%
52%
Roger Marshall (R)
42%
43%
46%
36%
16%
31%
47%
55%
44%
25%
15%
42%
36%
45%
8%
70%
27%
1%
85%
23%
2%
81%
15%
14%
33%
51%
41%
Someone else
4%
4%
3%
5%
4%
7%
3%
4%
4%
11%
0%
10%
1%
6%
4%
4%
5%
0%
4%
7%
1%
6%
11%
4%
4%
5%
4%
Undecided
5%
4%
4%
7%
6%
4%
4%
7%
4%
5%
5%
10%
3%
7%
2%
6%
7%
2%
4%
8%
2%
6%
8%
9%
4%
7%
4%
SEN_LEAN. U.S. Senate ballot, with leaners
Total
Likely voters
Gender
Age
Race
Education
Party registration
Party ID
2024 Vote
Region
Response
Total
Likely voters
Men
Women
18-29
30-44
45-64
65+
White
Black
Hispanic
Other
College
No college
Democrat
Republican
Non-Partisan/Other
Democrat
Republican
Independent/Other
Harris
Trump
Other
Did not vote
Kansas City & Kaw Valley
Rural Kansas
Wichita Metro
Unweighted n
1339
1267
721
604
189
283
437
430
1102
47
70
120
667
672
490
540
309
406
405
528
627
482
59
171
562
461
316
Adam Hamilton (D)
50%
50%
47%
53%
75%
59%
47%
35%
49%
63%
80%
38%
61%
43%
86%
20%
63%
98%
8%
62%
97%
7%
67%
73%
60%
37%
53%
Roger Marshall (R)
43%
44%
48%
38%
16%
33%
48%
58%
45%
25%
17%
45%
37%
48%
9%
73%
29%
1%
86%
27%
2%
84%
16%
16%
34%
54%
42%
Someone else
5%
4%
4%
6%
6%
7%
3%
4%
4%
12%
2%
12%
1%
7%
4%
4%
7%
1%
4%
8%
1%
7%
14%
7%
4%
6%
5%
Undecided
2%
2%
2%
3%
3%
1%
2%
3%
2%
0%
2%
4%
2%
2%
1%
3%
2%
1%
2%
3%
1%
3%
3%
4%
2%
3%
1%
GOV. Governor ballot
Total
Likely voters
Gender
Age
Race
Education
Party registration
Party ID
2024 Vote
Region
Response
Total
Likely voters
Men
Women
18-29
30-44
45-64
65+
White
Black
Hispanic
Other
College
No college
Democrat
Republican
Non-Partisan/Other
Democrat
Republican
Independent/Other
Harris
Trump
Other
Did not vote
Kansas City & Kaw Valley
Rural Kansas
Wichita Metro
Unweighted n
1339
1267
721
604
189
283
437
430
1102
47
70
120
667
672
490
540
309
406
405
528
627
482
59
171
562
461
316
Cindy Holscher (D)
48%
49%
44%
52%
70%
60%
46%
32%
46%
67%
75%
42%
57%
42%
84%
20%
57%
97%
6%
59%
95%
5%
63%
68%
57%
35%
51%
Ty Masterson (R)
47%
47%
50%
43%
22%
33%
49%
64%
49%
25%
20%
50%
40%
51%
12%
77%
31%
1%
93%
29%
2%
90%
16%
19%
37%
59%
43%
Someone else
2%
2%
3%
1%
2%
4%
2%
1%
2%
1%
0%
4%
1%
2%
1%
1%
5%
0%
0%
5%
1%
2%
13%
4%
1%
3%
2%
Undecided
4%
2%
3%
4%
5%
3%
3%
4%
3%
7%
5%
4%
2%
5%
3%
2%
7%
2%
1%
7%
2%
3%
8%
10%
4%
3%
3%
GOV_LEAN. Governor ballot, with leaners
Total
Likely voters
Gender
Age
Race
Education
Party registration
Party ID
2024 Vote
Region
Response
Total
Likely voters
Men
Women
18-29
30-44
45-64
65+
White
Black
Hispanic
Other
College
No college
Democrat
Republican
Non-Partisan/Other
Democrat
Republican
Independent/Other
Harris
Trump
Other
Did not vote
Kansas City & Kaw Valley
Rural Kansas
Wichita Metro
Unweighted n
1339
1267
721
604
189
283
437
430
1102
47
70
120
667
672
490
540
309
406
405
528
627
482
59
171
562
461
316
Cindy Holscher (D)
49%
49%
45%
53%
72%
61%
47%
32%
47%
71%
75%
42%
57%
43%
85%
20%
60%
98%
6%
61%
96%
5%
66%
72%
59%
35%
53%
Ty Masterson (R)
47%
48%
50%
44%
22%
34%
50%
65%
49%
28%
20%
52%
40%
52%
12%
78%
32%
1%
93%
30%
2%
91%
17%
19%
38%
60%
44%
Someone else
2%
2%
3%
1%
2%
4%
2%
2%
2%
1%
0%
4%
2%
3%
1%
1%
6%
0%
1%
6%
1%
2%
13%
4%
1%
4%
3%
Undecided
2%
1%
1%
2%
3%
2%
1%
1%
1%
0%
5%
2%
1%
2%
2%
1%
2%
1%
0%
3%
1%
1%
4%
5%
2%
1%
1%
HOUSE. U.S. House ballot
Total
Likely voters
Gender
Age
Race
Education
Party registration
Party ID
2024 Vote
Region
Response
Total
Likely voters
Men
Women
18-29
30-44
45-64
65+
White
Black
Hispanic
Other
College
No college
Democrat
Republican
Non-Partisan/Other
Democrat
Republican
Independent/Other
Harris
Trump
Other
Did not vote
Kansas City & Kaw Valley
Rural Kansas
Wichita Metro
Unweighted n
1339
1267
721
604
189
283
437
430
1102
47
70
120
667
672
490
540
309
406
405
528
627
482
59
171
562
461
316
Democratic candidate
45%
46%
41%
49%
69%
53%
43%
30%
43%
68%
76%
34%
54%
39%
83%
17%
53%
95%
5%
53%
91%
4%
43%
65%
57%
30%
47%
Republican candidate
44%
45%
48%
41%
20%
35%
44%
61%
46%
23%
18%
53%
37%
50%
13%
73%
28%
3%
90%
25%
4%
84%
13%
19%
35%
54%
46%
Someone else
3%
2%
4%
3%
6%
4%
2%
2%
3%
2%
0%
5%
1%
5%
1%
3%
6%
1%
1%
7%
2%
3%
24%
4%
3%
4%
3%
Undecided
7%
7%
8%
7%
5%
8%
10%
7%
8%
7%
6%
8%
8%
7%
3%
7%
12%
1%
4%
15%
3%
9%
20%
12%
6%
12%
4%
HOUSE_LEAN. U.S. House ballot, with leaners
Total
Likely voters
Gender
Age
Race
Education
Party registration
Party ID
2024 Vote
Region
Response
Total
Likely voters
Men
Women
18-29
30-44
45-64
65+
White
Black
Hispanic
Other
College
No college
Democrat
Republican
Non-Partisan/Other
Democrat
Republican
Independent/Other
Harris
Trump
Other
Did not vote
Kansas City & Kaw Valley
Rural Kansas
Wichita Metro
Unweighted n
1339
1267
721
604
189
283
437
430
1102
47
70
120
667
672
490
540
309
406
405
528
627
482
59
171
562
461
316
Democratic candidate
46%
47%
43%
50%
71%
54%
46%
30%
45%
68%
78%
35%
55%
40%
83%
17%
56%
96%
6%
56%
92%
5%
53%
68%
57%
33%
48%
Republican candidate
46%
46%
49%
42%
20%
37%
47%
62%
47%
23%
18%
55%
38%
51%
13%
75%
30%
3%
91%
27%
4%
87%
14%
19%
36%
56%
47%
Someone else
4%
3%
4%
3%
7%
5%
3%
2%
4%
4%
0%
6%
2%
5%
1%
3%
8%
1%
1%
9%
2%
4%
25%
6%
3%
5%
4%
Undecided
4%
4%
3%
5%
2%
4%
4%
5%
4%
5%
3%
5%
4%
4%
3%
4%
5%
0%
3%
8%
2%
5%
7%
7%
4%
6%
1%
APPROVE. Trump job approval
Total
Likely voters
Gender
Age
Race
Education
Party registration
Party ID
2024 Vote
Region
Response
Total
Likely voters
Men
Women
18-29
30-44
45-64
65+
White
Black
Hispanic
Other
College
No college
Democrat
Republican
Non-Partisan/Other
Democrat
Republican
Independent/Other
Harris
Trump
Other
Did not vote
Kansas City & Kaw Valley
Rural Kansas
Wichita Metro
Unweighted n
1353
1267
731
608
192
291
438
432
1110
48
71
124
672
681
492
545
316
410
407
536
629
487
59
178
566
468
319
Strongly approve
27%
28%
28%
25%
6%
13%
28%
44%
28%
15%
12%
23%
20%
31%
8%
45%
15%
4%
57%
10%
3%
51%
7%
6%
18%
35%
27%
Somewhat approve
14%
14%
16%
13%
10%
14%
19%
13%
15%
12%
6%
17%
14%
14%
3%
22%
13%
0%
23%
15%
0%
28%
6%
8%
12%
18%
13%
Somewhat disapprove
7%
6%
7%
7%
6%
6%
5%
10%
6%
5%
5%
15%
7%
7%
6%
7%
7%
2%
7%
9%
2%
10%
9%
8%
8%
6%
6%
Strongly disapprove
50%
51%
48%
53%
76%
65%
46%
32%
50%
67%
75%
40%
59%
45%
82%
23%
64%
94%
9%
64%
94%
9%
78%
75%
60%
38%
53%
Unsure
2%
1%
2%
2%
2%
3%
2%
1%
1%
2%
1%
6%
1%
3%
0%
3%
2%
0%
3%
2%
0%
3%
0%
4%
2%
2%
1%
Total approve
41%
42%
44%
38%
16%
26%
46%
57%
43%
27%
19%
39%
34%
46%
11%
67%
27%
4%
80%
25%
3%
78%
13%
14%
30%
54%
40%
Total disapprove
57%
57%
55%
60%
82%
71%
51%
42%
56%
72%
80%
55%
65%
52%
89%
30%
71%
96%
17%
73%
96%
19%
87%
82%
68%
44%
58%
SEX. Gender
Total
Likely voters
Gender
Age
Race
Education
Party registration
Party ID
2024 Vote
Region
Response
Total
Likely voters
Men
Women
18-29
30-44
45-64
65+
White
Black
Hispanic
Other
College
No college
Democrat
Republican
Non-Partisan/Other
Democrat
Republican
Independent/Other
Harris
Trump
Other
Did not vote
Kansas City & Kaw Valley
Rural Kansas
Wichita Metro
Unweighted n
1353
1267
731
608
192
291
438
432
1110
48
71
124
672
681
492
545
316
410
407
536
629
487
59
178
566
468
319
Man
55%
55%
100%
0%
58%
60%
55%
50%
55%
40%
66%
56%
57%
53%
39%
59%
63%
39%
58%
61%
48%
59%
65%
57%
58%
55%
49%
Woman
44%
44%
0%
100%
39%
40%
45%
50%
45%
59%
34%
40%
42%
46%
59%
41%
36%
60%
42%
38%
51%
41%
34%
42%
41%
45%
51%
Some other way
1%
1%
0%
0%
3%
0%
1%
0%
0%
1%
0%
3%
1%
1%
2%
0%
0%
1%
0%
1%
1%
0%
1%
1%
1%
1%
0%
AGE. Age
Total
Likely voters
Gender
Age
Race
Education
Party registration
Party ID
2024 Vote
Region
Response
Total
Likely voters
Men
Women
18-29
30-44
45-64
65+
White
Black
Hispanic
Other
College
No college
Democrat
Republican
Non-Partisan/Other
Democrat
Republican
Independent/Other
Harris
Trump
Other
Did not vote
Kansas City & Kaw Valley
Rural Kansas
Wichita Metro
Unweighted n
1353
1267
731
608
192
291
438
432
1110
48
71
124
672
681
492
545
316
410
407
536
629
487
59
178
566
468
319
18-29
15%
14%
16%
13%
100%
0%
0%
0%
12%
23%
43%
23%
12%
18%
22%
8%
21%
23%
7%
19%
16%
5%
7%
51%
18%
10%
18%
30-44
22%
21%
24%
20%
0%
100%
0%
0%
22%
19%
23%
21%
26%
20%
22%
19%
28%
25%
17%
26%
27%
17%
52%
22%
25%
21%
19%
45-64
29%
30%
29%
29%
0%
0%
100%
0%
29%
45%
20%
31%
32%
27%
28%
29%
30%
29%
28%
31%
30%
31%
23%
21%
30%
29%
29%
65+
33%
35%
31%
37%
0%
0%
0%
100%
36%
12%
14%
25%
30%
35%
28%
44%
20%
22%
49%
25%
27%
46%
17%
6%
28%
40%
34%
RACE. Race and ethnic background
Total
Likely voters
Gender
Age
Race
Education
Party registration
Party ID
2024 Vote
Region
Response
Total
Likely voters
Men
Women
18-29
30-44
45-64
65+
White
Black
Hispanic
Other
College
No college
Democrat
Republican
Non-Partisan/Other
Democrat
Republican
Independent/Other
Harris
Trump
Other
Did not vote
Kansas City & Kaw Valley
Rural Kansas
Wichita Metro
Unweighted n
1353
1267
731
608
192
291
438
432
1110
48
71
124
672
681
492
545
316
410
407
536
629
487
59
178
566
468
319
African-American or Black
3%
3%
2%
4%
5%
3%
5%
1%
0%
100%
0%
0%
3%
3%
6%
1%
3%
6%
2%
2%
4%
2%
5%
3%
4%
2%
4%
Asian-American, South-Asian, or Pacific Islander
2%
1%
1%
2%
5%
3%
1%
0%
0%
0%
0%
16%
2%
1%
3%
0%
2%
4%
1%
2%
3%
0%
1%
4%
3%
0%
1%
Hispanic or Latino
5%
5%
6%
4%
14%
5%
3%
2%
0%
0%
100%
0%
4%
6%
9%
1%
7%
8%
2%
7%
7%
2%
0%
13%
7%
3%
5%
Native American
1%
1%
1%
1%
2%
0%
2%
1%
0%
0%
0%
12%
1%
1%
1%
1%
1%
1%
1%
1%
0%
1%
3%
4%
1%
1%
2%
White or Caucasian
82%
82%
81%
83%
66%
82%
81%
89%
100%
0%
0%
0%
84%
80%
74%
89%
76%
78%
88%
78%
82%
85%
81%
66%
76%
90%
79%
More than one of the above
6%
6%
5%
6%
8%
7%
5%
5%
0%
0%
0%
55%
5%
7%
7%
5%
6%
4%
5%
8%
3%
7%
10%
9%
7%
3%
7%
Other
2%
2%
3%
0%
1%
0%
4%
1%
0%
0%
0%
17%
2%
2%
0%
1%
4%
1%
2%
2%
1%
2%
0%
1%
2%
1%
3%
EDUC. Highest level of education
Total
Likely voters
Gender
Age
Race
Education
Party registration
Party ID
2024 Vote
Region
Response
Total
Likely voters
Men
Women
18-29
30-44
45-64
65+
White
Black
Hispanic
Other
College
No college
Democrat
Republican
Non-Partisan/Other
Democrat
Republican
Independent/Other
Harris
Trump
Other
Did not vote
Kansas City & Kaw Valley
Rural Kansas
Wichita Metro
Unweighted n
1352
1266
731
607
192
291
438
431
1109
48
71
124
672
680
491
545
316
410
407
535
629
486
59
178
566
467
319
1st through 11th grade
2%
1%
1%
2%
3%
1%
2%
1%
1%
4%
4%
3%
0%
3%
2%
2%
1%
2%
2%
1%
1%
2%
0%
4%
2%
2%
1%
High school degree or GED
12%
12%
11%
13%
19%
11%
9%
13%
12%
11%
14%
17%
0%
20%
12%
13%
12%
10%
14%
12%
7%
14%
11%
22%
10%
15%
12%
Technical or vocational school
7%
7%
9%
5%
3%
4%
9%
9%
7%
12%
6%
4%
0%
12%
6%
9%
4%
5%
10%
5%
3%
10%
5%
6%
3%
11%
9%
Some college but no degree
27%
27%
25%
29%
32%
25%
25%
27%
27%
28%
27%
30%
0%
45%
25%
28%
27%
24%
29%
26%
24%
28%
8%
35%
26%
24%
32%
Associate's (2 year) degree
12%
11%
12%
12%
12%
12%
11%
13%
12%
8%
17%
9%
0%
20%
9%
10%
18%
11%
10%
15%
11%
13%
9%
13%
13%
14%
7%
Bachelor's (4 year) degree
24%
25%
23%
25%
23%
27%
26%
21%
25%
26%
16%
19%
60%
0%
27%
23%
23%
26%
23%
24%
30%
22%
28%
14%
26%
22%
24%
Graduate or professional degree
16%
17%
19%
13%
8%
19%
18%
16%
16%
11%
16%
17%
40%
0%
19%
15%
15%
21%
12%
17%
24%
12%
39%
6%
21%
12%
15%
College degree
40%
42%
42%
38%
31%
46%
44%
37%
41%
37%
32%
36%
100%
0%
46%
38%
38%
47%
35%
41%
54%
33%
67%
20%
46%
34%
38%
No college degree
60%
58%
58%
62%
69%
54%
56%
63%
59%
63%
68%
64%
0%
100%
54%
62%
62%
53%
65%
59%
46%
67%
33%
80%
54%
66%
62%
PID. Party identification
Total
Likely voters
Gender
Age
Race
Education
Party registration
Party ID
2024 Vote
Region
Response
Total
Likely voters
Men
Women
18-29
30-44
45-64
65+
White
Black
Hispanic
Other
College
No college
Democrat
Republican
Non-Partisan/Other
Democrat
Republican
Independent/Other
Harris
Trump
Other
Did not vote
Kansas City & Kaw Valley
Rural Kansas
Wichita Metro
Unweighted n
1353
1267
731
608
192
291
438
432
1110
48
71
124
672
681
492
545
316
410
407
536
629
487
59
178
566
468
319
Democrat
24%
24%
17%
32%
36%
27%
24%
16%
23%
47%
37%
19%
28%
21%
65%
5%
14%
100%
0%
0%
54%
1%
7%
24%
31%
15%
25%
Republican
38%
39%
40%
36%
17%
28%
36%
56%
41%
22%
14%
31%
33%
41%
8%
70%
15%
0%
100%
0%
3%
73%
8%
13%
28%
50%
37%
Independent
27%
27%
31%
23%
26%
29%
33%
22%
27%
21%
28%
32%
31%
25%
18%
18%
51%
0%
0%
71%
31%
21%
58%
34%
29%
26%
26%
Something else
9%
8%
11%
6%
18%
15%
5%
4%
8%
8%
18%
15%
6%
11%
7%
5%
17%
0%
0%
23%
10%
4%
25%
23%
10%
7%
10%
Unsure
2%
2%
1%
3%
2%
1%
2%
2%
2%
2%
4%
2%
1%
3%
2%
2%
3%
0%
0%
6%
1%
2%
3%
6%
1%
3%
2%
VOTE2024. 2024 presidential vote
Total
Likely voters
Gender
Age
Race
Education
Party registration
Party ID
2024 Vote
Region
Response
Total
Likely voters
Men
Women
18-29
30-44
45-64
65+
White
Black
Hispanic
Other
College
No college
Democrat
Republican
Non-Partisan/Other
Democrat
Republican
Independent/Other
Harris
Trump
Other
Did not vote
Kansas City & Kaw Valley
Rural Kansas
Wichita Metro
Unweighted n
1353
1267
731
608
192
291
438
432
1110
48
71
124
672
681
492
545
316
410
407
536
629
487
59
178
566
468
319
Kamala Harris (D)
37%
39%
32%
42%
39%
45%
37%
30%
37%
53%
48%
25%
50%
28%
73%
14%
39%
84%
3%
40%
100%
0%
0%
0%
47%
25%
36%
Donald Trump (R)
48%
49%
51%
44%
17%
36%
52%
67%
50%
31%
17%
50%
39%
53%
13%
81%
29%
2%
92%
33%
0%
100%
0%
0%
37%
61%
47%
Chase Oliver (L)
1%
1%
1%
1%
0%
2%
1%
1%
1%
0%
0%
1%
2%
0%
0%
1%
2%
0%
0%
2%
0%
0%
41%
0%
1%
1%
1%
Jill Stein (G)
1%
1%
1%
1%
1%
2%
0%
0%
1%
4%
0%
1%
1%
1%
0%
0%
2%
0%
0%
2%
0%
0%
34%
0%
1%
1%
1%
Someone else
1%
0%
1%
0%
0%
1%
1%
0%
1%
0%
0%
1%
1%
0%
0%
0%
1%
0%
0%
1%
0%
0%
25%
0%
1%
1%
0%
Did not vote
9%
6%
9%
8%
18%
12%
9%
2%
8%
9%
20%
13%
6%
11%
7%
3%
20%
7%
4%
15%
0%
0%
0%
68%
7%
10%
10%
Not eligible to vote
4%
3%
4%
4%
25%
1%
0%
0%
3%
4%
15%
8%
1%
7%
6%
1%
7%
6%
1%
6%
0%
0%
0%
32%
5%
2%
5%
REGION. Region
Total
Likely voters
Gender
Age
Race
Education
Party registration
Party ID
2024 Vote
Region
Response
Total
Likely voters
Men
Women
18-29
30-44
45-64
65+
White
Black
Hispanic
Other
College
No college
Democrat
Republican
Non-Partisan/Other
Democrat
Republican
Independent/Other
Harris
Trump
Other
Did not vote
Kansas City & Kaw Valley
Rural Kansas
Wichita Metro
Unweighted n
1353
1267
731
608
192
291
438
432
1110
48
71
124
672
681
492
545
316
410
407
536
629
487
59
178
566
468
319
Kansas City & Kaw Valley
41%
41%
44%
38%
49%
46%
42%
34%
38%
50%
58%
53%
48%
37%
55%
29%
48%
54%
30%
44%
53%
32%
44%
41%
100%
0%
0%
Rural Kansas
37%
36%
37%
37%
25%
36%
37%
44%
41%
22%
21%
21%
31%
41%
25%
49%
29%
23%
49%
34%
25%
47%
38%
34%
0%
100%
0%
Wichita Metro
22%
22%
19%
25%
26%
19%
22%
22%
21%
28%
21%
27%
21%
22%
20%
22%
23%
23%
21%
21%
22%
21%
18%
25%
0%
0%
100%
Weighting: Raked to sampling stratum, education, region, recalled 2024 presidential vote, whether the respondent has already voted in 2026, and phone type. Rescaled to mean 1 (untrimmed). n = 1174, design effect = 3.63, margin of error = ±5.4 points
SEN. U.S. Senate ballot
Total
Likely voters
Gender
Age
Race
Education
Party registration
Party ID
2024 Vote
Region
Response
Total
Likely voters
Men
Women
18-29
30-44
45-64
65+
White
Black
Hispanic
Other
College
No college
Democrat
Republican
Non-Partisan/Other
Democrat
Republican
Independent/Other
Harris
Trump
Other
Did not vote
Appalachia
Central
Cleveland
Columbus
Eastern
Miami Valley
Northwest
Unweighted n
1159
1122
580
563
66
243
420
430
965
83
22
89
619
540
486
423
250
422
320
417
625
417
37
80
80
187
206
165
199
222
100
Sherrod Brown (D)
49%
49%
47%
52%
58%
65%
45%
43%
47%
73%
72%
42%
59%
42%
77%
22%
46%
97%
7%
53%
96%
7%
32%
71%
26%
47%
58%
55%
45%
52%
50%
Jon Husted (R)
44%
45%
45%
42%
29%
24%
46%
54%
47%
22%
22%
34%
34%
50%
18%
72%
44%
1%
89%
32%
2%
85%
5%
8%
68%
47%
35%
38%
48%
43%
38%
Someone else
3%
3%
4%
2%
13%
8%
3%
1%
3%
5%
0%
5%
4%
3%
3%
1%
6%
1%
0%
9%
1%
3%
39%
10%
1%
1%
3%
3%
6%
2%
7%
Undecided
4%
3%
3%
4%
1%
4%
6%
2%
3%
1%
7%
18%
3%
4%
3%
4%
4%
1%
4%
6%
1%
5%
24%
11%
5%
6%
3%
4%
1%
3%
5%
SEN_LEAN. U.S. Senate ballot, with leaners
Total
Likely voters
Gender
Age
Race
Education
Party registration
Party ID
2024 Vote
Region
Response
Total
Likely voters
Men
Women
18-29
30-44
45-64
65+
White
Black
Hispanic
Other
College
No college
Democrat
Republican
Non-Partisan/Other
Democrat
Republican
Independent/Other
Harris
Trump
Other
Did not vote
Appalachia
Central
Cleveland
Columbus
Eastern
Miami Valley
Northwest
Unweighted n
1159
1122
580
563
66
243
420
430
965
83
22
89
619
540
486
423
250
422
320
417
625
417
37
80
80
187
206
165
199
222
100
Sherrod Brown (D)
50%
50%
48%
52%
58%
65%
45%
45%
48%
73%
72%
48%
60%
43%
77%
23%
47%
97%
8%
55%
97%
8%
54%
71%
27%
48%
58%
57%
45%
53%
50%
Jon Husted (R)
45%
46%
46%
43%
29%
24%
48%
54%
47%
22%
22%
41%
35%
51%
18%
73%
45%
1%
90%
33%
2%
86%
5%
8%
71%
47%
35%
39%
48%
43%
39%
Someone else
4%
4%
5%
3%
13%
9%
3%
1%
4%
5%
0%
6%
4%
4%
4%
2%
6%
1%
1%
10%
1%
5%
39%
10%
2%
2%
5%
3%
6%
2%
8%
Undecided
2%
1%
2%
1%
1%
3%
3%
0%
1%
1%
7%
5%
1%
2%
1%
2%
2%
1%
1%
3%
0%
2%
3%
11%
1%
3%
1%
0%
1%
2%
3%
GOV. Governor ballot
Total
Likely voters
Gender
Age
Race
Education
Party registration
Party ID
2024 Vote
Region
Response
Total
Likely voters
Men
Women
18-29
30-44
45-64
65+
White
Black
Hispanic
Other
College
No college
Democrat
Republican
Non-Partisan/Other
Democrat
Republican
Independent/Other
Harris
Trump
Other
Did not vote
Appalachia
Central
Cleveland
Columbus
Eastern
Miami Valley
Northwest
Unweighted n
1159
1122
580
563
66
243
420
430
965
83
22
89
619
540
486
423
250
422
320
417
625
417
37
80
80
187
206
165
199
222
100
Amy Acton (D)
51%
50%
49%
53%
63%
65%
48%
44%
49%
72%
64%
43%
61%
44%
78%
25%
46%
98%
8%
56%
98%
9%
60%
66%
26%
48%
61%
56%
44%
53%
53%
Vivek Ramaswamy (R)
43%
44%
44%
42%
29%
21%
48%
52%
46%
16%
22%
41%
33%
49%
17%
70%
45%
1%
88%
30%
1%
83%
5%
11%
73%
49%
33%
37%
45%
41%
36%
Someone else
4%
4%
5%
3%
7%
9%
3%
2%
4%
2%
7%
8%
5%
4%
3%
4%
6%
1%
3%
8%
1%
6%
14%
11%
2%
1%
2%
3%
8%
4%
7%
Undecided
3%
2%
2%
3%
1%
5%
2%
2%
2%
10%
7%
8%
1%
3%
3%
1%
4%
1%
1%
5%
0%
3%
21%
12%
0%
1%
4%
3%
3%
2%
4%
GOV_LEAN. Governor ballot, with leaners
Total
Likely voters
Gender
Age
Race
Education
Party registration
Party ID
2024 Vote
Region
Response
Total
Likely voters
Men
Women
18-29
30-44
45-64
65+
White
Black
Hispanic
Other
College
No college
Democrat
Republican
Non-Partisan/Other
Democrat
Republican
Independent/Other
Harris
Trump
Other
Did not vote
Appalachia
Central
Cleveland
Columbus
Eastern
Miami Valley
Northwest
Unweighted n
1159
1122
580
563
66
243
420
430
965
83
22
89
619
540
486
423
250
422
320
417
625
417
37
80
80
187
206
165
199
222
100
Amy Acton (D)
51%
51%
49%
53%
63%
65%
48%
45%
49%
72%
64%
48%
61%
45%
79%
25%
47%
98%
8%
58%
98%
9%
74%
66%
26%
48%
61%
59%
44%
54%
53%
Vivek Ramaswamy (R)
43%
44%
45%
42%
29%
21%
48%
53%
46%
16%
22%
43%
34%
50%
17%
70%
46%
1%
89%
30%
1%
84%
5%
11%
73%
49%
33%
37%
47%
41%
37%
Someone else
4%
4%
5%
3%
7%
11%
3%
2%
4%
7%
7%
8%
5%
4%
3%
4%
6%
1%
3%
9%
1%
6%
14%
17%
2%
2%
2%
3%
8%
5%
8%
Undecided
1%
1%
1%
2%
1%
3%
1%
0%
1%
6%
7%
1%
1%
2%
1%
1%
2%
0%
0%
3%
0%
1%
7%
6%
0%
0%
4%
0%
1%
1%
1%
HOUSE. U.S. House ballot
Total
Likely voters
Gender
Age
Race
Education
Party registration
Party ID
2024 Vote
Region
Response
Total
Likely voters
Men
Women
18-29
30-44
45-64
65+
White
Black
Hispanic
Other
College
No college
Democrat
Republican
Non-Partisan/Other
Democrat
Republican
Independent/Other
Harris
Trump
Other
Did not vote
Appalachia
Central
Cleveland
Columbus
Eastern
Miami Valley
Northwest
Unweighted n
1158
1121
579
563
66
243
420
429
964
83
22
89
619
539
486
423
249
421
320
417
624
417
37
80
80
186
206
165
199
222
100
Democratic candidate
48%
47%
45%
51%
62%
61%
42%
43%
46%
68%
64%
40%
57%
42%
77%
21%
43%
98%
7%
50%
93%
8%
40%
64%
26%
42%
57%
54%
43%
51%
49%
Republican candidate
43%
44%
46%
41%
26%
22%
47%
54%
47%
13%
22%
38%
33%
50%
16%
70%
46%
0%
89%
29%
1%
83%
5%
8%
71%
51%
32%
36%
45%
43%
37%
Someone else
4%
3%
4%
3%
7%
9%
3%
1%
3%
4%
3%
13%
4%
3%
3%
2%
6%
1%
0%
10%
1%
4%
40%
12%
2%
2%
2%
4%
7%
3%
5%
Undecided
5%
5%
5%
5%
5%
7%
8%
2%
4%
15%
11%
9%
6%
5%
5%
7%
5%
1%
4%
11%
5%
5%
14%
16%
2%
5%
8%
6%
5%
3%
9%
HOUSE_LEAN. U.S. House ballot, with leaners
Total
Likely voters
Gender
Age
Race
Education
Party registration
Party ID
2024 Vote
Region
Response
Total
Likely voters
Men
Women
18-29
30-44
45-64
65+
White
Black
Hispanic
Other
College
No college
Democrat
Republican
Non-Partisan/Other
Democrat
Republican
Independent/Other
Harris
Trump
Other
Did not vote
Appalachia
Central
Cleveland
Columbus
Eastern
Miami Valley
Northwest
Unweighted n
1158
1121
579
563
66
243
420
429
964
83
22
89
619
539
486
423
249
421
320
417
624
417
37
80
80
186
206
165
199
222
100
Democratic candidate
49%
49%
47%
52%
63%
63%
44%
43%
47%
73%
64%
40%
59%
43%
78%
22%
45%
98%
8%
53%
95%
9%
48%
68%
26%
43%
59%
55%
45%
51%
51%
Republican candidate
44%
45%
46%
42%
27%
22%
49%
54%
47%
18%
22%
41%
33%
51%
16%
71%
47%
0%
90%
31%
2%
85%
5%
8%
71%
51%
34%
37%
45%
43%
39%
Someone else
4%
4%
5%
3%
7%
10%
4%
1%
4%
5%
3%
13%
5%
4%
3%
2%
7%
1%
0%
11%
1%
4%
45%
12%
3%
3%
3%
5%
7%
3%
6%
Undecided
3%
3%
3%
2%
3%
5%
4%
1%
2%
4%
11%
7%
3%
3%
3%
4%
1%
1%
3%
4%
2%
2%
2%
12%
1%
3%
3%
3%
3%
3%
4%
APPROVE. Trump job approval
Total
Likely voters
Gender
Age
Race
Education
Party registration
Party ID
2024 Vote
Region
Response
Total
Likely voters
Men
Women
18-29
30-44
45-64
65+
White
Black
Hispanic
Other
College
No college
Democrat
Republican
Non-Partisan/Other
Democrat
Republican
Independent/Other
Harris
Trump
Other
Did not vote
Appalachia
Central
Cleveland
Columbus
Eastern
Miami Valley
Northwest
Unweighted n
1174
1122
588
569
67
249
425
433
978
84
22
90
623
551
489
428
257
423
323
428
626
421
37
90
83
190
209
167
200
223
102
Strongly approve
24%
25%
28%
20%
5%
7%
32%
30%
26%
5%
6%
22%
16%
29%
9%
43%
23%
2%
50%
16%
1%
47%
0%
3%
15%
18%
24%
19%
29%
34%
23%
Somewhat approve
16%
16%
14%
18%
24%
17%
13%
18%
16%
18%
25%
19%
12%
19%
5%
23%
21%
0%
30%
15%
0%
31%
8%
8%
40%
18%
12%
16%
16%
9%
16%
Somewhat disapprove
7%
7%
9%
5%
5%
6%
6%
10%
8%
3%
0%
4%
8%
7%
7%
9%
6%
5%
9%
8%
4%
10%
4%
9%
8%
21%
5%
5%
7%
2%
4%
Strongly disapprove
50%
50%
47%
54%
64%
68%
46%
42%
48%
72%
69%
47%
62%
42%
78%
23%
46%
93%
8%
58%
94%
9%
86%
71%
27%
42%
59%
59%
45%
53%
57%
Unsure
2%
2%
1%
3%
2%
2%
4%
1%
2%
1%
0%
8%
2%
3%
2%
2%
3%
0%
2%
4%
1%
3%
2%
10%
10%
2%
1%
1%
3%
1%
0%
Total approve
41%
41%
42%
39%
29%
23%
44%
48%
42%
23%
31%
41%
29%
48%
14%
66%
45%
2%
81%
30%
2%
78%
9%
10%
55%
35%
36%
35%
45%
44%
39%
Total disapprove
57%
57%
56%
59%
69%
74%
51%
51%
56%
76%
69%
50%
70%
49%
85%
33%
52%
98%
17%
66%
98%
19%
90%
80%
35%
63%
63%
64%
52%
55%
61%
SEX. Gender
Total
Likely voters
Gender
Age
Race
Education
Party registration
Party ID
2024 Vote
Region
Response
Total
Likely voters
Men
Women
18-29
30-44
45-64
65+
White
Black
Hispanic
Other
College
No college
Democrat
Republican
Non-Partisan/Other
Democrat
Republican
Independent/Other
Harris
Trump
Other
Did not vote
Appalachia
Central
Cleveland
Columbus
Eastern
Miami Valley
Northwest
Unweighted n
1174
1122
588
569
67
249
425
433
978
84
22
90
623
551
489
428
257
423
323
428
626
421
37
90
83
190
209
167
200
223
102
Man
53%
53%
100%
0%
61%
60%
54%
47%
53%
47%
46%
61%
61%
48%
46%
55%
57%
42%
49%
66%
49%
57%
67%
40%
27%
60%
56%
57%
53%
51%
54%
Woman
46%
46%
0%
100%
35%
39%
45%
52%
47%
51%
54%
27%
38%
52%
53%
44%
42%
58%
50%
32%
50%
42%
24%
57%
73%
39%
44%
43%
44%
47%
45%
Some other way
1%
1%
0%
0%
4%
1%
1%
1%
0%
2%
0%
12%
2%
1%
1%
1%
1%
1%
1%
1%
1%
1%
8%
3%
0%
1%
1%
0%
2%
1%
1%
AGE. Age
Total
Likely voters
Gender
Age
Race
Education
Party registration
Party ID
2024 Vote
Region
Response
Total
Likely voters
Men
Women
18-29
30-44
45-64
65+
White
Black
Hispanic
Other
College
No college
Democrat
Republican
Non-Partisan/Other
Democrat
Republican
Independent/Other
Harris
Trump
Other
Did not vote
Appalachia
Central
Cleveland
Columbus
Eastern
Miami Valley
Northwest
Unweighted n
1174
1122
588
569
67
249
425
433
978
84
22
90
623
551
489
428
257
423
323
428
626
421
37
90
83
190
209
167
200
223
102
18-29
6%
6%
7%
5%
100%
0%
0%
0%
6%
10%
7%
6%
6%
6%
6%
2%
10%
7%
1%
11%
6%
5%
11%
20%
5%
4%
10%
7%
6%
4%
6%
30-44
21%
20%
23%
18%
0%
100%
0%
0%
20%
21%
73%
17%
24%
19%
19%
13%
29%
25%
11%
27%
26%
14%
25%
37%
15%
16%
20%
25%
20%
21%
30%
45-64
32%
33%
33%
32%
0%
0%
100%
0%
31%
44%
14%
38%
38%
29%
30%
37%
31%
26%
32%
38%
29%
35%
40%
32%
29%
29%
33%
30%
35%
36%
26%
65+
41%
42%
37%
46%
0%
0%
0%
100%
43%
26%
6%
39%
33%
46%
46%
48%
31%
42%
55%
24%
39%
47%
24%
11%
52%
51%
36%
39%
39%
39%
38%
RACE. Race and ethnic background
Total
Likely voters
Gender
Age
Race
Education
Party registration
Party ID
2024 Vote
Region
Response
Total
Likely voters
Men
Women
18-29
30-44
45-64
65+
White
Black
Hispanic
Other
College
No college
Democrat
Republican
Non-Partisan/Other
Democrat
Republican
Independent/Other
Harris
Trump
Other
Did not vote
Appalachia
Central
Cleveland
Columbus
Eastern
Miami Valley
Northwest
Unweighted n
1174
1122
588
569
67
249
425
433
978
84
22
90
623
551
489
428
257
423
323
428
626
421
37
90
83
190
209
167
200
223
102
African-American or Black
7%
7%
6%
8%
11%
7%
9%
4%
0%
100%
0%
0%
6%
8%
14%
2%
4%
13%
1%
9%
10%
3%
11%
19%
3%
3%
9%
11%
5%
9%
7%
Asian-American, South-Asian, or Pacific Islander
1%
1%
1%
0%
2%
1%
0%
1%
0%
0%
0%
12%
1%
0%
1%
1%
1%
0%
0%
1%
1%
0%
2%
1%
0%
1%
0%
1%
0%
2%
0%
Hispanic or Latino
2%
2%
1%
2%
2%
6%
1%
0%
0%
0%
100%
0%
1%
2%
2%
0%
3%
3%
1%
1%
2%
1%
0%
2%
0%
1%
2%
4%
0%
0%
5%
Native American
1%
1%
1%
0%
0%
0%
1%
1%
0%
0%
0%
14%
1%
1%
0%
1%
1%
0%
1%
1%
0%
1%
3%
3%
1%
1%
0%
1%
0%
0%
5%
White or Caucasian
86%
86%
86%
87%
82%
83%
83%
90%
100%
0%
0%
0%
85%
86%
79%
90%
89%
80%
94%
82%
83%
91%
61%
70%
91%
92%
85%
77%
90%
85%
80%
More than one of the above
3%
3%
4%
2%
2%
3%
4%
3%
0%
0%
0%
57%
4%
3%
3%
4%
3%
3%
2%
4%
3%
3%
15%
3%
4%
2%
2%
6%
4%
3%
1%
Other
1%
1%
1%
0%
1%
1%
2%
1%
0%
0%
0%
18%
2%
1%
1%
2%
1%
1%
0%
2%
1%
1%
7%
2%
1%
0%
2%
0%
0%
1%
2%
EDUC. Highest level of education
Total
Likely voters
Gender
Age
Race
Education
Party registration
Party ID
2024 Vote
Region
Response
Total
Likely voters
Men
Women
18-29
30-44
45-64
65+
White
Black
Hispanic
Other
College
No college
Democrat
Republican
Non-Partisan/Other
Democrat
Republican
Independent/Other
Harris
Trump
Other
Did not vote
Appalachia
Central
Cleveland
Columbus
Eastern
Miami Valley
Northwest
Unweighted n
1174
1122
588
569
67
249
425
433
978
84
22
90
623
551
489
428
257
423
323
428
626
421
37
90
83
190
209
167
200
223
102
1st through 11th grade
1%
1%
1%
1%
3%
1%
1%
2%
0%
4%
7%
9%
0%
2%
2%
1%
1%
2%
0%
2%
1%
0%
16%
8%
0%
1%
1%
3%
1%
0%
2%
High school degree or GED
18%
17%
20%
16%
17%
9%
21%
20%
19%
14%
3%
5%
0%
29%
15%
16%
22%
16%
18%
19%
14%
20%
15%
26%
15%
26%
12%
10%
20%
19%
22%
Technical or vocational school
6%
6%
6%
7%
5%
7%
4%
8%
6%
10%
0%
2%
0%
10%
5%
5%
8%
9%
6%
4%
6%
6%
5%
7%
2%
4%
5%
6%
4%
12%
10%
Some college but no degree
21%
20%
19%
23%
28%
22%
17%
22%
21%
18%
35%
13%
0%
34%
20%
24%
18%
22%
20%
20%
19%
21%
15%
27%
12%
20%
24%
23%
25%
19%
16%
Associate's (2 year) degree
16%
16%
9%
23%
8%
17%
13%
17%
15%
22%
20%
17%
0%
25%
12%
13%
21%
10%
23%
12%
10%
21%
26%
10%
48%
9%
15%
11%
12%
14%
15%
Bachelor's (4 year) degree
20%
21%
22%
17%
28%
26%
25%
12%
20%
16%
9%
30%
52%
0%
21%
24%
16%
21%
18%
21%
23%
19%
11%
14%
14%
15%
23%
25%
21%
18%
21%
Graduate or professional degree
19%
19%
22%
14%
10%
19%
20%
19%
18%
15%
25%
23%
48%
0%
25%
17%
14%
20%
14%
22%
26%
13%
13%
9%
9%
25%
19%
22%
18%
18%
13%
College degree
38%
40%
44%
31%
38%
45%
45%
30%
38%
31%
34%
53%
100%
0%
46%
41%
29%
41%
32%
43%
49%
32%
23%
22%
23%
40%
42%
47%
39%
36%
35%
No college degree
62%
60%
56%
69%
62%
55%
55%
70%
62%
69%
66%
47%
0%
100%
54%
59%
71%
59%
68%
57%
51%
68%
77%
78%
77%
60%
58%
53%
61%
64%
65%
PID. Party identification
Total
Likely voters
Gender
Age
Race
Education
Party registration
Party ID
2024 Vote
Region
Response
Total
Likely voters
Men
Women
18-29
30-44
45-64
65+
White
Black
Hispanic
Other
College
No college
Democrat
Republican
Non-Partisan/Other
Democrat
Republican
Independent/Other
Harris
Trump
Other
Did not vote
Appalachia
Central
Cleveland
Columbus
Eastern
Miami Valley
Northwest
Unweighted n
1174
1122
588
569
67
249
425
433
978
84
22
90
623
551
489
428
257
423
323
428
626
421
37
90
83
190
209
167
200
223
102
Democrat
29%
29%
23%
36%
34%
35%
23%
30%
27%
53%
55%
20%
31%
28%
52%
7%
27%
100%
0%
0%
62%
2%
2%
31%
12%
23%
38%
33%
24%
31%
37%
Republican
37%
38%
34%
40%
7%
20%
36%
50%
40%
4%
22%
29%
31%
40%
16%
63%
33%
0%
100%
0%
4%
69%
1%
7%
62%
46%
23%
31%
45%
29%
35%
Independent
28%
27%
35%
19%
43%
32%
33%
19%
27%
37%
7%
33%
28%
27%
24%
26%
33%
0%
0%
81%
27%
25%
75%
36%
24%
26%
34%
25%
22%
34%
22%
Something else
5%
5%
6%
3%
15%
11%
4%
1%
5%
4%
9%
11%
7%
3%
5%
3%
7%
0%
0%
15%
6%
3%
21%
13%
1%
3%
5%
9%
6%
5%
5%
Unsure
2%
1%
1%
2%
1%
2%
3%
0%
1%
3%
7%
7%
2%
1%
3%
1%
1%
0%
0%
5%
1%
1%
1%
13%
2%
1%
1%
1%
3%
2%
1%
VOTE2024. 2024 presidential vote
Total
Likely voters
Gender
Age
Race
Education
Party registration
Party ID
2024 Vote
Region
Response
Total
Likely voters
Men
Women
18-29
30-44
45-64
65+
White
Black
Hispanic
Other
College
No college
Democrat
Republican
Non-Partisan/Other
Democrat
Republican
Independent/Other
Harris
Trump
Other
Did not vote
Appalachia
Central
Cleveland
Columbus
Eastern
Miami Valley
Northwest
Unweighted n
1174
1122
588
569
67
249
425
433
978
84
22
90
623
551
489
428
257
423
323
428
626
421
37
90
83
190
209
167
200
223
102
Kamala Harris (D)
42%
43%
39%
46%
39%
53%
38%
40%
40%
59%
64%
38%
54%
35%
70%
18%
36%
90%
5%
41%
100%
0%
0%
0%
15%
38%
53%
51%
36%
44%
45%
Donald Trump (R)
50%
51%
54%
46%
38%
34%
54%
57%
53%
22%
28%
43%
42%
55%
21%
80%
52%
3%
94%
43%
0%
100%
0%
0%
81%
54%
41%
39%
57%
46%
42%
Chase Oliver (L)
1%
1%
1%
0%
1%
2%
0%
0%
0%
1%
0%
2%
0%
1%
0%
0%
1%
0%
0%
1%
0%
0%
25%
0%
1%
0%
1%
0%
1%
1%
0%
Jill Stein (G)
1%
1%
1%
1%
3%
1%
1%
1%
1%
2%
0%
8%
1%
1%
1%
0%
2%
0%
0%
3%
0%
0%
48%
0%
0%
1%
1%
3%
0%
1%
2%
Someone else
1%
0%
1%
0%
0%
0%
2%
0%
1%
0%
0%
1%
0%
1%
0%
0%
1%
0%
0%
2%
0%
0%
27%
0%
0%
0%
0%
0%
2%
0%
0%
Did not vote
5%
4%
4%
7%
14%
10%
5%
2%
5%
14%
7%
4%
3%
7%
7%
2%
7%
5%
1%
9%
0%
0%
0%
89%
3%
6%
3%
5%
4%
7%
9%
Not eligible to vote
1%
0%
0%
0%
5%
0%
1%
0%
0%
2%
0%
5%
0%
1%
1%
0%
1%
1%
0%
1%
0%
0%
0%
11%
0%
0%
1%
1%
1%
1%
0%
REGION. Region
Total
Likely voters
Gender
Age
Race
Education
Party registration
Party ID
2024 Vote
Region
Response
Total
Likely voters
Men
Women
18-29
30-44
45-64
65+
White
Black
Hispanic
Other
College
No college
Democrat
Republican
Non-Partisan/Other
Democrat
Republican
Independent/Other
Harris
Trump
Other
Did not vote
Appalachia
Central
Cleveland
Columbus
Eastern
Miami Valley
Northwest
Unweighted n
1174
1122
588
569
67
249
425
433
978
84
22
90
623
551
489
428
257
423
323
428
626
421
37
90
83
190
209
167
200
223
102
Appalachia
8%
8%
4%
13%
6%
6%
7%
11%
9%
4%
1%
8%
5%
10%
3%
6%
15%
3%
14%
6%
3%
13%
4%
4%
100%
0%
0%
0%
0%
0%
0%
Central
15%
15%
17%
12%
10%
11%
13%
18%
16%
6%
8%
12%
15%
14%
14%
17%
13%
12%
18%
13%
13%
16%
8%
17%
0%
100%
0%
0%
0%
0%
0%
Cleveland
18%
19%
19%
17%
31%
18%
19%
16%
18%
24%
26%
13%
20%
17%
23%
17%
15%
24%
11%
21%
23%
15%
15%
13%
0%
0%
100%
0%
0%
0%
0%
Columbus
13%
13%
14%
12%
14%
16%
12%
12%
12%
20%
32%
21%
16%
11%
14%
15%
10%
15%
11%
13%
16%
10%
19%
14%
0%
0%
0%
100%
0%
0%
0%
Eastern
18%
18%
19%
18%
18%
18%
20%
17%
19%
13%
4%
15%
19%
18%
16%
23%
16%
15%
22%
17%
16%
21%
26%
15%
0%
0%
0%
0%
100%
0%
0%
Miami Valley
19%
19%
18%
19%
13%
19%
21%
18%
19%
24%
4%
19%
18%
20%
22%
16%
19%
20%
15%
22%
20%
17%
16%
24%
0%
0%
0%
0%
0%
100%
0%
Northwest
8%
8%
9%
8%
8%
12%
7%
8%
8%
9%
25%
12%
8%
9%
8%
5%
13%
11%
8%
7%
9%
7%
11%
14%
0%
0%
0%
0%
0%
0%
100%
Weighting: Raked to sampling stratum, education, region, recalled 2024 presidential vote, whether the respondent has already voted in 2026, and phone type. Rescaled to mean 1 (untrimmed). n = 1342, design effect = 2.30, margin of error = ±4.1 points
SEN. U.S. Senate ballot
Total
Likely voters
Gender
Age
Race
Education
Party registration
Party ID
2024 Vote
District
Response
Total
Likely voters
Men
Women
18-29
30-44
45-64
65+
White
Black
Hispanic
Other
College
No college
Democrat
Republican
Non-Partisan/Other
Democrat
Republican
Independent/Other
Harris
Trump
Other
Did not vote
CD1
CD2
Unweighted n
1334
1322
660
662
58
206
444
626
1231
9
17
77
773
561
444
422
468
395
373
566
748
486
48
50
749
585
Troy Jackson (D)
49%
50%
42%
56%
70%
60%
39%
48%
51%
15%
33%
26%
64%
40%
81%
8%
53%
91%
3%
56%
89%
4%
48%
39%
60%
38%
Susan Collins (R)
46%
46%
53%
39%
25%
33%
58%
46%
44%
66%
67%
65%
32%
54%
13%
89%
40%
4%
94%
37%
6%
92%
34%
45%
37%
55%
Someone else
2%
1%
1%
2%
5%
3%
1%
1%
1%
0%
0%
6%
1%
2%
0%
1%
3%
0%
1%
3%
1%
1%
19%
4%
2%
1%
Undecided
4%
3%
4%
3%
0%
4%
2%
4%
3%
19%
1%
3%
4%
4%
6%
2%
3%
4%
2%
4%
4%
3%
0%
11%
1%
6%
SEN_LEAN. U.S. Senate ballot, with leaners
Total
Likely voters
Gender
Age
Race
Education
Party registration
Party ID
2024 Vote
District
Response
Total
Likely voters
Men
Women
18-29
30-44
45-64
65+
White
Black
Hispanic
Other
College
No college
Democrat
Republican
Non-Partisan/Other
Democrat
Republican
Independent/Other
Harris
Trump
Other
Did not vote
CD1
CD2
Unweighted n
1334
1322
660
662
58
206
444
626
1231
9
17
77
773
561
444
422
468
395
373
566
748
486
48
50
749
585
Troy Jackson (D)
49%
50%
42%
56%
70%
61%
39%
49%
52%
15%
33%
26%
64%
40%
81%
8%
54%
92%
3%
56%
90%
4%
48%
39%
60%
38%
Susan Collins (R)
47%
47%
55%
40%
25%
34%
59%
47%
45%
85%
67%
68%
33%
55%
15%
90%
41%
5%
95%
39%
7%
93%
34%
56%
37%
57%
Someone else
2%
2%
2%
2%
5%
3%
2%
1%
2%
0%
0%
6%
1%
3%
0%
1%
4%
0%
1%
4%
2%
1%
19%
4%
2%
2%
Undecided
2%
2%
2%
2%
0%
2%
0%
3%
2%
0%
1%
0%
2%
1%
4%
1%
1%
3%
1%
2%
2%
2%
0%
0%
0%
3%
GOV. Governor ballot
Total
Likely voters
Gender
Age
Race
Education
Party registration
Party ID
2024 Vote
District
Response
Total
Likely voters
Men
Women
18-29
30-44
45-64
65+
White
Black
Hispanic
Other
College
No college
Democrat
Republican
Non-Partisan/Other
Democrat
Republican
Independent/Other
Harris
Trump
Other
Did not vote
CD1
CD2
Unweighted n
1335
1323
661
662
58
206
444
627
1232
9
17
77
773
562
445
422
468
396
373
566
749
486
48
50
749
586
Hannah Pingree (D)
53%
53%
43%
62%
63%
61%
42%
55%
55%
15%
26%
27%
67%
44%
87%
10%
56%
98%
5%
57%
94%
4%
50%
60%
61%
44%
Bobby Charles (R)
41%
41%
49%
33%
19%
31%
54%
39%
38%
79%
65%
66%
26%
49%
10%
84%
33%
1%
90%
30%
2%
87%
22%
34%
32%
50%
Someone else
4%
4%
6%
3%
11%
6%
4%
4%
4%
7%
9%
8%
5%
4%
2%
4%
8%
1%
2%
8%
3%
5%
26%
1%
5%
3%
Undecided
2%
2%
2%
2%
7%
2%
1%
3%
3%
0%
0%
0%
3%
2%
2%
3%
3%
0%
2%
4%
0%
4%
2%
6%
2%
3%
GOV_LEAN. Governor ballot, with leaners
Total
Likely voters
Gender
Age
Race
Education
Party registration
Party ID
2024 Vote
District
Response
Total
Likely voters
Men
Women
18-29
30-44
45-64
65+
White
Black
Hispanic
Other
College
No college
Democrat
Republican
Non-Partisan/Other
Democrat
Republican
Independent/Other
Harris
Trump
Other
Did not vote
CD1
CD2
Unweighted n
1335
1323
661
662
58
206
444
627
1232
9
17
77
773
562
445
422
468
396
373
566
749
486
48
50
749
586
Hannah Pingree (D)
53%
53%
44%
62%
63%
62%
42%
55%
56%
15%
26%
27%
67%
44%
87%
10%
57%
98%
6%
58%
95%
4%
51%
60%
61%
44%
Bobby Charles (R)
41%
41%
49%
34%
19%
31%
54%
40%
39%
79%
65%
66%
26%
50%
10%
85%
34%
1%
91%
31%
2%
88%
22%
39%
32%
50%
Someone else
5%
5%
7%
4%
19%
6%
4%
5%
5%
7%
9%
8%
6%
5%
3%
4%
9%
1%
2%
11%
3%
7%
26%
1%
6%
4%
Undecided
1%
1%
1%
0%
0%
2%
0%
1%
1%
0%
0%
0%
1%
0%
0%
1%
1%
0%
1%
1%
0%
1%
1%
0%
0%
1%
HOUSE. U.S. House ballot
Total
Likely voters
Gender
Age
Race
Education
Party registration
Party ID
2024 Vote
District
Response
Total
Likely voters
Men
Women
18-29
30-44
45-64
65+
White
Black
Hispanic
Other
College
No college
Democrat
Republican
Non-Partisan/Other
Democrat
Republican
Independent/Other
Harris
Trump
Other
Did not vote
CD1
CD2
Unweighted n
1335
1323
661
662
58
206
444
627
1232
9
17
77
773
562
445
422
468
396
373
566
749
486
48
50
749
586
Democratic candidate
51%
52%
43%
59%
65%
61%
41%
53%
54%
15%
24%
27%
65%
43%
86%
9%
54%
95%
6%
56%
92%
5%
49%
46%
60%
43%
Republican candidate
42%
42%
50%
34%
20%
29%
53%
42%
40%
79%
75%
59%
27%
51%
10%
87%
33%
4%
92%
30%
3%
89%
16%
23%
34%
50%
Someone else
2%
2%
2%
2%
6%
3%
1%
1%
1%
7%
1%
7%
1%
2%
1%
1%
4%
0%
0%
4%
2%
1%
27%
0%
3%
1%
Undecided
5%
4%
5%
5%
10%
7%
5%
4%
5%
0%
1%
7%
6%
4%
3%
3%
9%
1%
2%
10%
3%
5%
9%
31%
4%
6%
HOUSE_LEAN. U.S. House ballot, with leaners
Total
Likely voters
Gender
Age
Race
Education
Party registration
Party ID
2024 Vote
District
Response
Total
Likely voters
Men
Women
18-29
30-44
45-64
65+
White
Black
Hispanic
Other
College
No college
Democrat
Republican
Non-Partisan/Other
Democrat
Republican
Independent/Other
Harris
Trump
Other
Did not vote
CD1
CD2
Unweighted n
1335
1323
661
662
58
206
444
627
1232
9
17
77
773
562
445
422
468
396
373
566
749
486
48
50
749
586
Democratic candidate
53%
53%
44%
61%
65%
62%
43%
54%
55%
15%
24%
27%
67%
44%
87%
10%
57%
95%
6%
59%
93%
5%
49%
60%
60%
45%
Republican candidate
42%
43%
50%
35%
20%
32%
54%
42%
40%
79%
75%
60%
28%
51%
11%
88%
34%
4%
92%
31%
3%
91%
17%
23%
35%
51%
Someone else
2%
2%
3%
2%
6%
3%
2%
2%
2%
7%
1%
8%
2%
3%
1%
1%
5%
0%
0%
5%
2%
1%
32%
2%
3%
1%
Undecided
3%
2%
3%
2%
9%
3%
1%
2%
2%
0%
0%
5%
3%
2%
2%
1%
4%
1%
1%
5%
1%
4%
3%
15%
2%
4%
APPROVE. Trump job approval
Total
Likely voters
Gender
Age
Race
Education
Party registration
Party ID
2024 Vote
District
Response
Total
Likely voters
Men
Women
18-29
30-44
45-64
65+
White
Black
Hispanic
Other
College
No college
Democrat
Republican
Non-Partisan/Other
Democrat
Republican
Independent/Other
Harris
Trump
Other
Did not vote
CD1
CD2
Unweighted n
1342
1323
665
665
58
209
447
628
1239
9
17
77
778
564
448
424
470
397
376
569
750
487
48
55
753
589
Strongly approve
20%
20%
23%
18%
10%
9%
27%
22%
20%
71%
17%
15%
13%
25%
6%
44%
14%
2%
53%
8%
1%
44%
7%
5%
19%
22%
Somewhat approve
17%
17%
21%
12%
8%
15%
22%
15%
15%
8%
27%
39%
10%
21%
4%
31%
17%
0%
30%
18%
1%
36%
10%
10%
11%
23%
Somewhat disapprove
6%
6%
7%
6%
10%
10%
7%
4%
5%
7%
23%
18%
7%
6%
0%
12%
7%
1%
8%
8%
2%
10%
7%
26%
5%
8%
Strongly disapprove
55%
55%
48%
62%
70%
65%
43%
57%
58%
15%
33%
27%
70%
46%
87%
13%
60%
94%
8%
64%
94%
8%
76%
57%
63%
46%
Unsure
2%
2%
1%
2%
2%
1%
2%
2%
2%
0%
0%
1%
1%
2%
3%
1%
1%
3%
1%
1%
2%
2%
0%
2%
2%
1%
Total approve
37%
37%
44%
30%
18%
24%
49%
37%
35%
79%
44%
55%
23%
46%
10%
74%
31%
2%
83%
26%
2%
80%
17%
15%
30%
44%
Total disapprove
61%
61%
55%
68%
80%
75%
49%
61%
63%
21%
56%
44%
77%
52%
87%
25%
67%
95%
16%
72%
96%
18%
83%
83%
68%
54%
SEX. Gender
Total
Likely voters
Gender
Age
Race
Education
Party registration
Party ID
2024 Vote
District
Response
Total
Likely voters
Men
Women
18-29
30-44
45-64
65+
White
Black
Hispanic
Other
College
No college
Democrat
Republican
Non-Partisan/Other
Democrat
Republican
Independent/Other
Harris
Trump
Other
Did not vote
CD1
CD2
Unweighted n
1342
1323
665
665
58
209
447
628
1239
9
17
77
778
564
448
424
470
397
376
569
750
487
48
55
753
589
Man
50%
50%
100%
0%
46%
56%
54%
45%
48%
75%
62%
70%
50%
49%
39%
57%
53%
36%
55%
55%
40%
60%
66%
45%
48%
51%
Woman
49%
49%
0%
100%
50%
41%
45%
55%
51%
12%
38%
28%
49%
49%
60%
42%
45%
62%
45%
43%
58%
40%
23%
55%
50%
48%
Some other way
1%
1%
0%
0%
4%
2%
1%
1%
1%
13%
0%
2%
1%
1%
1%
1%
2%
2%
0%
2%
2%
0%
10%
0%
2%
1%
AGE. Age
Total
Likely voters
Gender
Age
Race
Education
Party registration
Party ID
2024 Vote
District
Response
Total
Likely voters
Men
Women
18-29
30-44
45-64
65+
White
Black
Hispanic
Other
College
No college
Democrat
Republican
Non-Partisan/Other
Democrat
Republican
Independent/Other
Harris
Trump
Other
Did not vote
CD1
CD2
Unweighted n
1342
1323
665
665
58
209
447
628
1239
9
17
77
778
564
448
424
470
397
376
569
750
487
48
55
753
589
18-29
6%
6%
5%
6%
100%
0%
0%
0%
5%
51%
33%
12%
6%
6%
6%
2%
8%
8%
2%
7%
5%
3%
23%
34%
8%
4%
30-44
19%
19%
21%
16%
0%
100%
0%
0%
18%
5%
5%
29%
28%
13%
19%
17%
21%
18%
13%
23%
21%
15%
44%
20%
21%
16%
45-64
29%
29%
31%
27%
0%
0%
100%
0%
29%
39%
46%
27%
24%
32%
23%
35%
30%
18%
40%
28%
23%
37%
16%
29%
29%
29%
65+
46%
47%
42%
52%
0%
0%
0%
100%
48%
5%
17%
32%
42%
49%
52%
46%
41%
55%
45%
41%
51%
45%
16%
17%
42%
51%
RACE. Race and ethnic background
Total
Likely voters
Gender
Age
Race
Education
Party registration
Party ID
2024 Vote
District
Response
Total
Likely voters
Men
Women
18-29
30-44
45-64
65+
White
Black
Hispanic
Other
College
No college
Democrat
Republican
Non-Partisan/Other
Democrat
Republican
Independent/Other
Harris
Trump
Other
Did not vote
CD1
CD2
Unweighted n
1342
1323
665
665
58
209
447
628
1239
9
17
77
778
564
448
424
470
397
376
569
750
487
48
55
753
589
African-American or Black
1%
1%
1%
0%
5%
0%
1%
0%
0%
100%
0%
0%
1%
0%
0%
1%
1%
0%
1%
1%
0%
0%
7%
2%
1%
0%
Asian-American, South-Asian, or Pacific Islander
1%
1%
1%
1%
2%
1%
1%
0%
0%
0%
0%
9%
1%
1%
1%
1%
0%
1%
1%
0%
1%
0%
0%
4%
1%
0%
Hispanic or Latino
1%
1%
1%
1%
6%
0%
2%
0%
0%
0%
100%
0%
1%
1%
1%
1%
1%
1%
1%
1%
1%
2%
0%
3%
1%
1%
Native American
2%
2%
3%
2%
5%
1%
1%
3%
0%
0%
0%
36%
1%
3%
1%
1%
5%
2%
2%
3%
1%
4%
1%
1%
1%
4%
White or Caucasian
91%
92%
88%
95%
75%
89%
91%
95%
100%
0%
0%
0%
92%
91%
96%
90%
89%
95%
91%
89%
96%
89%
85%
74%
93%
90%
More than one of the above
3%
2%
4%
1%
2%
8%
2%
1%
0%
0%
0%
38%
3%
2%
1%
4%
3%
1%
3%
3%
1%
3%
5%
16%
2%
4%
Other
1%
1%
2%
0%
5%
0%
2%
1%
0%
0%
0%
17%
1%
1%
0%
1%
2%
0%
1%
2%
1%
2%
2%
0%
2%
1%
EDUC. Highest level of education
Total
Likely voters
Gender
Age
Race
Education
Party registration
Party ID
2024 Vote
District
Response
Total
Likely voters
Men
Women
18-29
30-44
45-64
65+
White
Black
Hispanic
Other
College
No college
Democrat
Republican
Non-Partisan/Other
Democrat
Republican
Independent/Other
Harris
Trump
Other
Did not vote
CD1
CD2
Unweighted n
1342
1323
665
665
58
209
447
628
1239
9
17
77
778
564
448
424
470
397
376
569
750
487
48
55
753
589
1st through 11th grade
1%
1%
1%
1%
0%
0%
0%
1%
1%
0%
8%
0%
0%
1%
1%
1%
0%
1%
1%
0%
0%
1%
0%
0%
0%
1%
High school degree or GED
17%
16%
18%
16%
9%
10%
21%
18%
17%
10%
27%
13%
0%
27%
10%
24%
17%
12%
28%
12%
11%
23%
12%
35%
11%
23%
Technical or vocational school
7%
7%
9%
5%
0%
7%
6%
9%
7%
19%
0%
14%
0%
11%
4%
9%
8%
3%
11%
7%
4%
11%
11%
4%
7%
7%
Some college but no degree
23%
23%
21%
24%
37%
15%
23%
24%
22%
0%
23%
31%
0%
37%
19%
22%
26%
17%
21%
28%
21%
24%
15%
34%
23%
22%
Associate's (2 year) degree
15%
15%
13%
16%
14%
12%
18%
14%
15%
13%
5%
7%
0%
24%
14%
14%
16%
14%
16%
14%
14%
16%
17%
10%
13%
16%
Bachelor's (4 year) degree
19%
19%
21%
16%
25%
28%
16%
16%
19%
5%
28%
14%
49%
0%
23%
16%
17%
22%
14%
20%
22%
16%
13%
13%
23%
14%
Graduate or professional degree
19%
20%
17%
21%
15%
29%
16%
18%
19%
54%
9%
20%
51%
0%
28%
14%
16%
31%
10%
19%
28%
10%
33%
4%
22%
16%
College degree
38%
39%
39%
38%
40%
57%
32%
34%
38%
58%
37%
35%
100%
0%
51%
30%
33%
53%
24%
39%
50%
26%
46%
17%
45%
31%
No college degree
62%
61%
61%
62%
60%
43%
68%
66%
62%
42%
63%
65%
0%
100%
49%
70%
67%
47%
76%
61%
50%
74%
54%
83%
55%
69%
PID. Party identification
Total
Likely voters
Gender
Age
Race
Education
Party registration
Party ID
2024 Vote
District
Response
Total
Likely voters
Men
Women
18-29
30-44
45-64
65+
White
Black
Hispanic
Other
College
No college
Democrat
Republican
Non-Partisan/Other
Democrat
Republican
Independent/Other
Harris
Trump
Other
Did not vote
CD1
CD2
Unweighted n
1342
1323
665
665
58
209
447
628
1239
9
17
77
778
564
448
424
470
397
376
569
750
487
48
55
753
589
Democrat
28%
29%
20%
36%
38%
28%
18%
34%
29%
20%
26%
15%
39%
22%
63%
3%
16%
100%
0%
0%
53%
1%
5%
28%
33%
23%
Republican
31%
31%
35%
28%
10%
21%
43%
30%
31%
39%
32%
31%
19%
38%
9%
76%
15%
0%
100%
0%
3%
67%
6%
16%
25%
38%
Independent
34%
34%
39%
30%
32%
33%
35%
34%
34%
41%
30%
37%
33%
35%
22%
16%
60%
0%
0%
84%
38%
28%
57%
38%
35%
33%
Something else
6%
5%
5%
5%
19%
15%
4%
2%
5%
0%
12%
15%
7%
5%
5%
4%
8%
0%
0%
14%
6%
3%
32%
14%
6%
6%
Unsure
1%
1%
1%
1%
1%
3%
0%
0%
1%
0%
0%
1%
1%
1%
0%
1%
1%
0%
0%
2%
1%
1%
0%
4%
1%
1%
VOTE2024. 2024 presidential vote
Total
Likely voters
Gender
Age
Race
Education
Party registration
Party ID
2024 Vote
District
Response
Total
Likely voters
Men
Women
18-29
30-44
45-64
65+
White
Black
Hispanic
Other
College
No college
Democrat
Republican
Non-Partisan/Other
Democrat
Republican
Independent/Other
Harris
Trump
Other
Did not vote
CD1
CD2
Unweighted n
1340
1321
664
664
58
209
446
627
1237
9
17
77
778
562
447
423
470
397
375
568
750
487
48
55
752
588
Kamala Harris (D)
51%
51%
41%
60%
47%
56%
40%
56%
53%
23%
25%
27%
66%
41%
86%
9%
52%
95%
4%
55%
100%
0%
0%
0%
58%
42%
Donald Trump (R)
43%
44%
53%
35%
22%
34%
55%
42%
42%
33%
65%
59%
29%
52%
11%
88%
37%
1%
93%
34%
0%
100%
0%
0%
35%
52%
Chase Oliver (L)
1%
1%
1%
0%
2%
2%
1%
0%
1%
0%
0%
1%
1%
1%
0%
0%
1%
1%
0%
1%
0%
0%
27%
0%
0%
1%
Jill Stein (G)
1%
1%
1%
0%
5%
3%
0%
0%
1%
0%
0%
0%
1%
1%
1%
0%
3%
0%
0%
3%
0%
0%
41%
0%
2%
0%
Someone else
1%
1%
1%
1%
4%
2%
0%
0%
1%
34%
0%
2%
1%
1%
0%
1%
2%
0%
0%
2%
0%
0%
33%
0%
1%
0%
Did not vote
3%
1%
3%
3%
9%
4%
3%
1%
2%
0%
10%
9%
2%
4%
1%
2%
5%
1%
2%
5%
0%
0%
0%
81%
2%
3%
Not eligible to vote
1%
1%
0%
1%
11%
0%
0%
0%
1%
10%
0%
2%
0%
1%
1%
0%
1%
2%
0%
0%
0%
0%
0%
19%
1%
0%
REGION. Congressional district
Total
Likely voters
Gender
Age
Race
Education
Party registration
Party ID
2024 Vote
District
Response
Total
Likely voters
Men
Women
18-29
30-44
45-64
65+
White
Black
Hispanic
Other
College
No college
Democrat
Republican
Non-Partisan/Other
Democrat
Republican
Independent/Other
Harris
Trump
Other
Did not vote
CD1
CD2
Unweighted n
1342
1323
665
665
58
209
447
628
1239
9
17
77
778
564
448
424
470
397
376
569
750
487
48
55
753
589
CD1
51%
51%
50%
53%
70%
58%
52%
46%
52%
77%
67%
39%
61%
46%
61%
41%
51%
61%
41%
52%
59%
41%
69%
48%
100%
0%
CD2
49%
49%
50%
47%
30%
42%
48%
54%
48%
23%
33%
61%
39%
54%
39%
59%
49%
39%
59%
48%
41%
59%
31%
52%
0%
100%
Weighting: Raked to sampling stratum, education, region, recalled 2024 presidential vote, whether the respondent has already voted in 2026, and phone type. Rescaled to mean 1 (untrimmed). n = 1423, design effect = 2.04, margin of error = ±3.7 points
SEN. U.S. Senate ballot
Total
Likely voters
Gender
Age
Race
Education
Modeled party (L2)
Party ID
2024 Vote
Region
Response
Total
Likely voters
Men
Women
18-29
30-44
45-64
65+
White
Black
Hispanic
Asian/Pacific Islander
Other
College
No college
Democrat
Republican
Non-Partisan/Other
Democrat
Republican
Independent/Other
Harris
Trump
Other
Did not vote
Greater Minnesota
Iron Range
Southeast
Twin Cities
Twin Suburbs
Unweighted n
1410
1365
761
609
199
357
447
407
1190
57
33
25
105
793
616
520
506
384
558
314
537
795
453
38
124
345
101
119
540
305
Peggy Flanagan (D)
51%
52%
42%
63%
65%
63%
37%
52%
50%
61%
54%
87%
51%
60%
45%
72%
34%
51%
93%
2%
49%
92%
3%
47%
62%
38%
45%
52%
68%
45%
Michele Tafoya (R)
42%
43%
52%
30%
27%
31%
57%
41%
44%
24%
42%
4%
44%
36%
47%
23%
62%
39%
3%
95%
39%
3%
91%
29%
16%
55%
49%
39%
28%
47%
Someone else
2%
1%
1%
2%
1%
2%
1%
3%
1%
1%
5%
0%
4%
1%
2%
2%
2%
2%
2%
1%
3%
1%
1%
14%
5%
2%
2%
2%
1%
2%
Undecided
5%
4%
4%
5%
7%
4%
5%
4%
5%
13%
0%
9%
1%
3%
6%
3%
3%
8%
3%
2%
9%
3%
4%
9%
18%
5%
5%
7%
3%
6%
SEN_LEAN. U.S. Senate ballot, with leaners
Total
Likely voters
Gender
Age
Race
Education
Modeled party (L2)
Party ID
2024 Vote
Region
Response
Total
Likely voters
Men
Women
18-29
30-44
45-64
65+
White
Black
Hispanic
Asian/Pacific Islander
Other
College
No college
Democrat
Republican
Non-Partisan/Other
Democrat
Republican
Independent/Other
Harris
Trump
Other
Did not vote
Greater Minnesota
Iron Range
Southeast
Twin Cities
Twin Suburbs
Unweighted n
1410
1365
761
609
199
357
447
407
1190
57
33
25
105
793
616
520
506
384
558
314
537
795
453
38
124
345
101
119
540
305
Peggy Flanagan (D)
52%
52%
43%
64%
67%
64%
38%
52%
51%
65%
54%
87%
51%
60%
46%
72%
34%
52%
95%
2%
50%
93%
4%
47%
64%
39%
45%
53%
69%
46%
Michele Tafoya (R)
42%
43%
52%
31%
28%
31%
57%
42%
44%
24%
42%
4%
44%
36%
48%
24%
62%
39%
3%
95%
39%
3%
92%
29%
17%
55%
49%
40%
28%
47%
Someone else
3%
2%
2%
3%
1%
4%
2%
3%
2%
1%
5%
5%
4%
1%
4%
3%
2%
4%
2%
1%
5%
2%
3%
14%
5%
2%
5%
4%
2%
3%
Undecided
3%
2%
3%
3%
4%
1%
3%
4%
3%
10%
0%
4%
1%
3%
3%
2%
2%
5%
1%
2%
6%
2%
1%
9%
14%
4%
1%
3%
1%
4%
GOV. Governor ballot
Total
Likely voters
Gender
Age
Race
Education
Modeled party (L2)
Party ID
2024 Vote
Region
Response
Total
Likely voters
Men
Women
18-29
30-44
45-64
65+
White
Black
Hispanic
Asian/Pacific Islander
Other
College
No college
Democrat
Republican
Non-Partisan/Other
Democrat
Republican
Independent/Other
Harris
Trump
Other
Did not vote
Greater Minnesota
Iron Range
Southeast
Twin Cities
Twin Suburbs
Unweighted n
1409
1365
761
608
199
357
447
406
1189
57
33
25
105
793
615
520
505
384
558
313
537
795
452
38
124
344
101
119
540
305
Amy Klobuchar (D)
53%
53%
43%
66%
67%
60%
38%
57%
53%
53%
51%
82%
50%
62%
46%
69%
37%
55%
96%
2%
50%
95%
4%
36%
66%
40%
45%
54%
68%
47%
Lisa Demuth (R)
41%
42%
50%
31%
26%
32%
55%
40%
43%
36%
42%
4%
40%
35%
47%
24%
60%
38%
1%
96%
38%
2%
91%
26%
15%
53%
52%
36%
28%
47%
Someone else
3%
2%
4%
1%
3%
5%
4%
0%
2%
1%
5%
5%
8%
2%
4%
4%
3%
2%
3%
0%
5%
1%
3%
29%
4%
4%
0%
3%
2%
4%
Undecided
3%
2%
3%
2%
4%
2%
3%
2%
2%
10%
3%
9%
2%
2%
4%
4%
0%
5%
1%
1%
6%
2%
2%
9%
15%
3%
2%
6%
2%
2%
GOV_LEAN. Governor ballot, with leaners
Total
Likely voters
Gender
Age
Race
Education
Modeled party (L2)
Party ID
2024 Vote
Region
Response
Total
Likely voters
Men
Women
18-29
30-44
45-64
65+
White
Black
Hispanic
Asian/Pacific Islander
Other
College
No college
Democrat
Republican
Non-Partisan/Other
Democrat
Republican
Independent/Other
Harris
Trump
Other
Did not vote
Greater Minnesota
Iron Range
Southeast
Twin Cities
Twin Suburbs
Unweighted n
1409
1365
761
608
199
357
447
406
1189
57
33
25
105
793
615
520
505
384
558
313
537
795
452
38
124
344
101
119
540
305
Amy Klobuchar (D)
53%
53%
43%
67%
68%
61%
38%
57%
53%
53%
51%
87%
51%
62%
46%
70%
37%
55%
96%
2%
51%
95%
4%
40%
68%
41%
46%
54%
69%
47%
Lisa Demuth (R)
42%
43%
50%
31%
26%
32%
56%
41%
43%
36%
42%
4%
40%
35%
47%
25%
60%
39%
1%
97%
39%
2%
92%
29%
18%
54%
52%
38%
28%
47%
Someone else
3%
3%
5%
1%
3%
6%
4%
1%
3%
1%
8%
5%
9%
2%
5%
5%
3%
3%
3%
0%
7%
1%
4%
31%
5%
4%
1%
5%
3%
4%
Undecided
1%
1%
2%
1%
3%
0%
2%
2%
1%
10%
0%
4%
0%
1%
2%
1%
0%
3%
0%
1%
3%
1%
1%
0%
10%
2%
0%
3%
0%
2%
HOUSE. U.S. House ballot
Total
Likely voters
Gender
Age
Race
Education
Modeled party (L2)
Party ID
2024 Vote
Region
Response
Total
Likely voters
Men
Women
18-29
30-44
45-64
65+
White
Black
Hispanic
Asian/Pacific Islander
Other
College
No college
Democrat
Republican
Non-Partisan/Other
Democrat
Republican
Independent/Other
Harris
Trump
Other
Did not vote
Greater Minnesota
Iron Range
Southeast
Twin Cities
Twin Suburbs
Unweighted n
1411
1366
761
610
199
357
447
408
1191
57
33
25
105
794
616
520
506
385
558
315
537
795
453
38
124
346
101
119
540
305
Democratic candidate
53%
53%
45%
63%
68%
60%
38%
57%
52%
68%
54%
91%
51%
60%
47%
69%
37%
55%
94%
2%
53%
93%
5%
43%
70%
39%
48%
53%
67%
49%
Republican candidate
39%
40%
45%
31%
26%
27%
53%
39%
41%
18%
39%
4%
37%
34%
43%
21%
56%
38%
1%
94%
32%
3%
86%
9%
12%
51%
44%
38%
26%
43%
Someone else
2%
2%
3%
1%
1%
6%
1%
1%
2%
3%
5%
5%
4%
2%
3%
3%
2%
1%
1%
0%
6%
1%
2%
23%
5%
1%
2%
3%
2%
3%
Undecided
6%
5%
7%
4%
5%
7%
8%
3%
6%
11%
2%
0%
7%
4%
7%
6%
5%
6%
4%
4%
9%
3%
7%
24%
12%
8%
6%
6%
5%
5%
HOUSE_LEAN. U.S. House ballot, with leaners
Total
Likely voters
Gender
Age
Race
Education
Modeled party (L2)
Party ID
2024 Vote
Region
Response
Total
Likely voters
Men
Women
18-29
30-44
45-64
65+
White
Black
Hispanic
Asian/Pacific Islander
Other
College
No college
Democrat
Republican
Non-Partisan/Other
Democrat
Republican
Independent/Other
Harris
Trump
Other
Did not vote
Greater Minnesota
Iron Range
Southeast
Twin Cities
Twin Suburbs
Unweighted n
1411
1366
761
610
199
357
447
408
1191
57
33
25
105
794
616
520
506
385
558
315
537
795
453
38
124
346
101
119
540
305
Democratic candidate
54%
54%
45%
65%
70%
61%
38%
58%
53%
68%
54%
91%
51%
61%
48%
71%
38%
56%
95%
2%
55%
94%
5%
47%
72%
40%
49%
55%
68%
51%
Republican candidate
40%
41%
47%
33%
26%
30%
53%
41%
43%
18%
42%
4%
37%
35%
45%
23%
57%
40%
1%
96%
34%
3%
88%
15%
16%
54%
45%
38%
27%
44%
Someone else
3%
3%
5%
1%
1%
7%
4%
1%
3%
4%
5%
5%
10%
2%
5%
4%
4%
2%
3%
0%
7%
2%
4%
26%
5%
4%
4%
4%
2%
4%
Undecided
2%
2%
3%
1%
3%
2%
4%
1%
2%
10%
0%
0%
2%
2%
2%
3%
1%
2%
1%
2%
4%
1%
2%
12%
7%
3%
2%
3%
2%
1%
APPROVE. Trump job approval
Total
Likely voters
Gender
Age
Race
Education
Modeled party (L2)
Party ID
2024 Vote
Region
Response
Total
Likely voters
Men
Women
18-29
30-44
45-64
65+
White
Black
Hispanic
Asian/Pacific Islander
Other
College
No college
Democrat
Republican
Non-Partisan/Other
Democrat
Republican
Independent/Other
Harris
Trump
Other
Did not vote
Greater Minnesota
Iron Range
Southeast
Twin Cities
Twin Suburbs
Unweighted n
1422
1366
768
613
204
361
448
409
1197
60
34
25
106
794
627
523
509
390
558
319
544
795
457
38
131
349
101
122
542
308
Strongly approve
23%
23%
28%
17%
13%
10%
33%
26%
22%
12%
23%
4%
35%
17%
27%
13%
34%
21%
3%
56%
15%
1%
49%
7%
17%
30%
24%
31%
15%
22%
Somewhat approve
16%
16%
19%
12%
7%
16%
20%
15%
16%
5%
22%
0%
16%
14%
17%
10%
21%
15%
3%
32%
16%
2%
33%
10%
4%
21%
20%
18%
10%
16%
Somewhat disapprove
5%
4%
7%
3%
5%
7%
5%
4%
5%
14%
5%
0%
6%
4%
6%
4%
6%
5%
1%
4%
10%
1%
8%
21%
13%
6%
7%
1%
3%
9%
Strongly disapprove
54%
55%
46%
67%
68%
66%
42%
52%
56%
53%
51%
96%
36%
64%
47%
68%
39%
57%
91%
4%
59%
94%
8%
60%
66%
43%
49%
48%
70%
50%
Unsure
2%
1%
1%
2%
6%
1%
1%
3%
1%
16%
0%
0%
7%
1%
3%
5%
0%
2%
2%
4%
1%
2%
3%
2%
1%
1%
0%
2%
3%
3%
Total approve
38%
39%
46%
29%
20%
26%
53%
41%
38%
17%
44%
4%
51%
31%
44%
23%
54%
36%
5%
87%
30%
3%
81%
17%
20%
50%
43%
49%
24%
38%
Total disapprove
59%
60%
53%
69%
74%
73%
46%
56%
61%
67%
56%
96%
42%
68%
53%
72%
45%
62%
92%
9%
69%
95%
16%
81%
78%
48%
57%
50%
73%
59%
SEX. Gender
Total
Likely voters
Gender
Age
Race
Education
Modeled party (L2)
Party ID
2024 Vote
Region
Response
Total
Likely voters
Men
Women
18-29
30-44
45-64
65+
White
Black
Hispanic
Asian/Pacific Islander
Other
College
No college
Democrat
Republican
Non-Partisan/Other
Democrat
Republican
Independent/Other
Harris
Trump
Other
Did not vote
Greater Minnesota
Iron Range
Southeast
Twin Cities
Twin Suburbs
Unweighted n
1422
1366
768
614
203
361
449
409
1198
59
34
25
106
795
626
523
509
390
559
318
544
796
456
38
131
349
101
122
542
308
Man
57%
57%
100%
0%
55%
61%
58%
54%
55%
74%
47%
50%
67%
50%
62%
51%
65%
53%
41%
64%
68%
47%
68%
74%
59%
58%
65%
46%
57%
59%
Woman
41%
41%
0%
100%
40%
34%
41%
46%
43%
21%
46%
47%
27%
47%
37%
47%
32%
45%
57%
36%
28%
51%
31%
15%
37%
40%
34%
53%
40%
38%
Some other way
2%
2%
0%
0%
5%
5%
1%
0%
1%
5%
8%
2%
5%
3%
2%
2%
2%
2%
2%
0%
4%
2%
1%
11%
4%
1%
1%
1%
3%
3%
AGE. Age
Total
Likely voters
Gender
Age
Race
Education
Modeled party (L2)
Party ID
2024 Vote
Region
Response
Total
Likely voters
Men
Women
18-29
30-44
45-64
65+
White
Black
Hispanic
Asian/Pacific Islander
Other
College
No college
Democrat
Republican
Non-Partisan/Other
Democrat
Republican
Independent/Other
Harris
Trump
Other
Did not vote
Greater Minnesota
Iron Range
Southeast
Twin Cities
Twin Suburbs
Unweighted n
1423
1366
768
614
204
361
449
409
1198
60
34
25
106
795
627
524
509
390
559
319
544
796
457
38
131
349
101
122
542
309
18-29
13%
12%
12%
13%
100%
0%
0%
0%
10%
35%
30%
37%
20%
12%
14%
21%
5%
15%
15%
11%
14%
13%
10%
16%
41%
10%
9%
10%
17%
16%
30-44
22%
22%
24%
18%
0%
100%
0%
0%
22%
25%
39%
42%
13%
29%
17%
26%
13%
29%
23%
14%
28%
26%
18%
41%
17%
16%
17%
16%
31%
22%
45-64
31%
32%
32%
31%
0%
0%
100%
0%
33%
24%
28%
17%
26%
30%
32%
25%
42%
24%
23%
41%
32%
24%
42%
24%
20%
34%
31%
34%
24%
35%
65+
33%
34%
32%
37%
0%
0%
0%
100%
34%
16%
3%
3%
42%
28%
37%
28%
39%
32%
39%
35%
26%
38%
31%
18%
21%
40%
42%
40%
28%
27%
RACE. Race and ethnic background
Total
Likely voters
Gender
Age
Race
Education
Modeled party (L2)
Party ID
2024 Vote
Region
Response
Total
Likely voters
Men
Women
18-29
30-44
45-64
65+
White
Black
Hispanic
Asian/Pacific Islander
Other
College
No college
Democrat
Republican
Non-Partisan/Other
Democrat
Republican
Independent/Other
Harris
Trump
Other
Did not vote
Greater Minnesota
Iron Range
Southeast
Twin Cities
Twin Suburbs
Unweighted n
1422
1365
768
613
204
361
449
408
1197
60
34
25
106
794
627
524
509
389
559
318
544
796
457
38
131
348
101
122
542
309
African-American or Black
5%
4%
5%
2%
13%
6%
4%
2%
0%
100%
0%
0%
0%
5%
5%
8%
3%
3%
4%
5%
6%
3%
4%
4%
20%
2%
1%
3%
7%
8%
Asian-American, South-Asian, or Pacific Islander
2%
2%
1%
2%
4%
3%
1%
0%
0%
0%
0%
100%
0%
2%
2%
3%
0%
2%
3%
0%
2%
2%
0%
4%
4%
0%
1%
0%
3%
2%
Hispanic or Latino
2%
2%
2%
2%
4%
3%
2%
0%
0%
0%
100%
0%
0%
2%
2%
4%
1%
1%
2%
2%
2%
2%
2%
4%
3%
1%
1%
1%
3%
2%
Native American
4%
4%
4%
4%
3%
1%
2%
7%
0%
0%
0%
0%
33%
1%
5%
6%
1%
5%
7%
3%
1%
5%
3%
0%
2%
5%
6%
7%
2%
2%
White or Caucasian
80%
82%
78%
86%
62%
82%
84%
83%
100%
0%
0%
0%
0%
85%
77%
70%
88%
84%
79%
84%
79%
82%
83%
73%
56%
81%
88%
82%
79%
79%
More than one of the above
5%
4%
6%
4%
8%
4%
4%
6%
0%
0%
0%
0%
45%
3%
6%
8%
2%
5%
4%
2%
8%
5%
3%
12%
14%
5%
3%
6%
5%
6%
Other
2%
3%
4%
0%
6%
2%
3%
1%
0%
0%
0%
0%
22%
2%
3%
2%
5%
1%
2%
4%
2%
1%
5%
3%
0%
6%
0%
1%
1%
2%
EDUC. Highest level of education
Total
Likely voters
Gender
Age
Race
Education
Modeled party (L2)
Party ID
2024 Vote
Region
Response
Total
Likely voters
Men
Women
18-29
30-44
45-64
65+
White
Black
Hispanic
Asian/Pacific Islander
Other
College
No college
Democrat
Republican
Non-Partisan/Other
Democrat
Republican
Independent/Other
Harris
Trump
Other
Did not vote
Greater Minnesota
Iron Range
Southeast
Twin Cities
Twin Suburbs
Unweighted n
1422
1365
767
614
204
361
448
409
1198
60
34
25
105
795
627
523
509
390
558
319
544
795
457
38
131
348
101
122
542
309
1st through 11th grade
1%
1%
0%
1%
1%
0%
0%
1%
1%
0%
0%
0%
1%
0%
1%
1%
1%
1%
1%
1%
0%
0%
1%
0%
2%
1%
0%
2%
0%
1%
High school degree or GED
15%
13%
18%
10%
24%
12%
13%
16%
12%
25%
15%
17%
32%
0%
26%
15%
12%
20%
14%
19%
13%
10%
17%
12%
39%
21%
10%
23%
8%
16%
Technical or vocational school
9%
10%
12%
7%
2%
8%
11%
12%
10%
7%
7%
10%
5%
0%
16%
8%
12%
7%
7%
11%
10%
8%
12%
11%
5%
10%
12%
11%
7%
10%
Some college but no degree
20%
20%
21%
18%
22%
8%
19%
27%
20%
16%
7%
17%
23%
0%
34%
20%
20%
19%
18%
21%
20%
19%
21%
8%
21%
17%
30%
18%
19%
20%
Associate's (2 year) degree
13%
14%
12%
16%
12%
16%
16%
9%
13%
8%
23%
14%
17%
0%
23%
10%
16%
15%
11%
15%
14%
12%
16%
22%
6%
16%
15%
9%
11%
15%
Bachelor's (4 year) degree
27%
27%
23%
30%
31%
32%
27%
20%
29%
25%
29%
32%
12%
63%
0%
27%
26%
26%
29%
23%
27%
31%
23%
27%
14%
21%
19%
22%
35%
25%
Graduate or professional degree
15%
16%
14%
18%
8%
24%
13%
15%
16%
18%
19%
10%
12%
37%
0%
19%
14%
13%
20%
11%
14%
20%
10%
20%
12%
14%
14%
15%
19%
13%
College degree
42%
43%
37%
48%
39%
56%
40%
35%
44%
44%
48%
41%
23%
100%
0%
46%
40%
39%
49%
33%
41%
51%
33%
47%
26%
35%
33%
37%
54%
38%
No college degree
58%
57%
63%
52%
61%
44%
60%
65%
56%
56%
52%
59%
77%
0%
100%
54%
60%
61%
51%
67%
59%
49%
67%
53%
74%
65%
67%
63%
46%
62%
PID. Party identification
Total
Likely voters
Gender
Age
Race
Education
Modeled party (L2)
Party ID
2024 Vote
Region
Response
Total
Likely voters
Men
Women
18-29
30-44
45-64
65+
White
Black
Hispanic
Asian/Pacific Islander
Other
College
No college
Democrat
Republican
Non-Partisan/Other
Democrat
Republican
Independent/Other
Harris
Trump
Other
Did not vote
Greater Minnesota
Iron Range
Southeast
Twin Cities
Twin Suburbs
Unweighted n
1422
1365
768
613
204
361
449
408
1198
60
34
25
105
794
627
524
509
389
559
319
544
795
457
38
131
349
100
122
542
309
Democrat
35%
36%
25%
50%
39%
37%
25%
41%
34%
28%
31%
60%
41%
41%
31%
50%
25%
31%
100%
0%
0%
66%
3%
2%
28%
31%
29%
36%
42%
31%
Republican
29%
29%
32%
25%
23%
19%
38%
31%
31%
28%
26%
4%
25%
23%
34%
18%
41%
27%
0%
100%
0%
1%
65%
3%
10%
42%
30%
30%
17%
32%
Independent
25%
25%
30%
18%
20%
25%
28%
25%
25%
29%
27%
13%
25%
24%
26%
18%
28%
31%
0%
0%
71%
22%
25%
61%
33%
22%
31%
26%
25%
27%
Something else
9%
8%
10%
6%
13%
17%
7%
2%
9%
2%
17%
21%
8%
11%
7%
13%
5%
8%
0%
0%
24%
9%
5%
31%
20%
5%
9%
6%
13%
8%
Unsure
2%
2%
2%
1%
5%
2%
1%
1%
1%
13%
0%
3%
2%
1%
3%
2%
2%
3%
0%
0%
6%
2%
1%
2%
9%
1%
1%
2%
3%
2%
VOTE2024. 2024 presidential vote
Total
Likely voters
Gender
Age
Race
Education
Modeled party (L2)
Party ID
2024 Vote
Region
Response
Total
Likely voters
Men
Women
18-29
30-44
45-64
65+
White
Black
Hispanic
Asian/Pacific Islander
Other
College
No college
Democrat
Republican
Non-Partisan/Other
Democrat
Republican
Independent/Other
Harris
Trump
Other
Did not vote
Greater Minnesota
Iron Range
Southeast
Twin Cities
Twin Suburbs
Unweighted n
1422
1365
768
613
204
361
449
408
1197
60
34
25
106
794
627
524
509
389
559
318
544
796
457
38
131
348
101
122
542
309
Kamala Harris (D)
48%
50%
39%
61%
45%
56%
37%
55%
49%
32%
47%
73%
46%
59%
40%
61%
35%
48%
91%
2%
44%
100%
0%
0%
0%
37%
43%
47%
62%
43%
Donald Trump (R)
43%
43%
51%
32%
31%
35%
57%
40%
45%
37%
36%
4%
41%
34%
49%
26%
60%
41%
4%
95%
38%
0%
100%
0%
0%
56%
53%
38%
28%
48%
Chase Oliver (L)
1%
1%
1%
0%
1%
2%
1%
0%
1%
0%
4%
2%
1%
0%
1%
1%
1%
1%
0%
0%
2%
0%
0%
40%
0%
1%
3%
1%
0%
1%
Jill Stein (G)
0%
0%
1%
0%
0%
1%
0%
0%
0%
0%
0%
0%
0%
1%
0%
1%
0%
0%
0%
0%
1%
0%
0%
18%
0%
0%
0%
0%
1%
0%
Someone else
1%
1%
1%
0%
1%
2%
0%
0%
1%
2%
0%
4%
2%
1%
1%
1%
0%
1%
0%
0%
2%
0%
0%
43%
0%
0%
0%
0%
2%
0%
Did not vote
4%
2%
6%
3%
7%
5%
4%
4%
3%
21%
6%
0%
9%
3%
5%
5%
3%
6%
2%
2%
9%
0%
0%
0%
63%
4%
1%
10%
3%
5%
Not eligible to vote
3%
2%
2%
4%
15%
1%
1%
0%
2%
8%
7%
18%
2%
1%
3%
4%
0%
3%
4%
0%
3%
0%
0%
0%
37%
2%
1%
3%
4%
2%
REGION. Region
Total
Likely voters
Gender
Age
Race
Education
Modeled party (L2)
Party ID
2024 Vote
Region
Response
Total
Likely voters
Men
Women
18-29
30-44
45-64
65+
White
Black
Hispanic
Asian/Pacific Islander
Other
College
No college
Democrat
Republican
Non-Partisan/Other
Democrat
Republican
Independent/Other
Harris
Trump
Other
Did not vote
Greater Minnesota
Iron Range
Southeast
Twin Cities
Twin Suburbs
Unweighted n
1423
1366
768
614
204
361
449
409
1198
60
34
25
106
795
627
524
509
390
559
319
544
796
457
38
131
349
101
122
542
309
Greater Minnesota
24%
25%
25%
24%
18%
18%
27%
29%
25%
8%
18%
4%
35%
20%
27%
17%
28%
29%
22%
35%
19%
19%
32%
20%
19%
100%
0%
0%
0%
0%
Iron Range
7%
8%
8%
6%
5%
6%
7%
9%
8%
1%
2%
5%
6%
6%
8%
8%
6%
7%
6%
7%
8%
6%
9%
10%
2%
0%
100%
0%
0%
0%
Southeast
13%
12%
11%
17%
9%
9%
14%
16%
13%
7%
7%
0%
16%
12%
14%
11%
13%
15%
13%
13%
12%
13%
11%
8%
24%
0%
0%
100%
0%
0%
Twin Cities
31%
32%
31%
30%
39%
43%
24%
26%
30%
44%
52%
62%
23%
40%
25%
48%
22%
21%
37%
18%
35%
40%
20%
48%
31%
0%
0%
0%
100%
0%
Twin Suburbs
24%
23%
25%
23%
28%
25%
28%
20%
24%
40%
21%
29%
20%
22%
26%
15%
31%
27%
22%
27%
25%
22%
28%
14%
24%
0%
0%
0%
0%
100%
Description of Methods
Sampling
We sampled potential respondents from the L2 voter file of registered voters in Kansas, Ohio, Maine, and Minnesota. The population was divided into 28 non-overlapping strata in Kansas, 36 in Ohio, 26 in Maine, and 36 in Minnesota. These sampling strata are based on race, age, participation in the 2024 general election, L2’s party alignment, and L2’s educational attainment categorical model. This stratification schema was used to define a target number of completes for each stratum, sampled inversely proportional to expected response rates based on past surveys, oversampling to allow for variation from these expected response rates. After defining stratification and targets, we then limited the sample to records with available phone numbers.
Questionnaire
The full questionnaire is available below.
Full questionnaire
qregistered: Are you registered to vote in [State]?
Yes
No ⇒ TERMINATE
qturnout: As you may know, on November 3 there will be elections for US Senate, Governor and other offices. How likely are you to vote in that election?
Definitely will vote ⇒ qsen
Probably will vote ⇒ qsen
50-50 chance of voting ⇒ qsen
Probably will not vote ⇒ qsen
Definitely will not vote ⇒ qapprove
Already voted ⇒ qsen_already
qsen_already: In the election for US Senate, who did you vote for? [Rotate 1-2]
Republican [Name]
Democrat [Name]
Someone Else
qgov_already: In the election for governor, who did you vote for? [Rotate 1-2]
Republican [Name]
Democrat [Name]
Someone Else
qhouse_already: In the election for Congress, who did you vote for? [Rotate 1-2]
The Democratic Candidate ⇒ qapprove
The Republican Candidate ⇒ qapprove
Someone else ⇒ qapprove
qsen: If the election for US Senate were held today, who would you vote for? [Rotate 1-2]
Republican [Name] ⇒ qgov
Democrat [Name] ⇒ qgov
Someone Else ⇒ qgov
Undecided ⇒ qsen_push
qsen_push: I know you have not made up your mind yet, but if you had to decide today, who would you vote for? [Rotate 1-2, same as qsen]
Republican [Name]
Democrat [Name]
Someone Else
Undecided
qgov: If the election for governor were held today, who would you vote for? [Rotate 1-2]
Republican [Name] ⇒ qhouse
Democrat [Name] ⇒ qhouse
Someone Else ⇒ qhouse
Undecided ⇒ qgov_push
qgov_push: I know you have not made up your mind yet, but if you had to decide today, who would you vote for? [Rotate 1-2, same as qgov]
Republican [Name]
Democrat [Name]
Someone Else
Undecided
qhouse: If the 2026 election for US Congress were held today, who would you vote for? [Rotate 1-2]
The Democratic Candidate ⇒ qapprove
The Republican Candidates ⇒ qapprove
Other ⇒ qapprove
Undecided ⇒ qhouse_push
qhouse_push: I know you have not made up your mind yet, but if you had to decide today, who would you vote for? [Rotate 1-2, same as qhouse]
The Democratic Candidate
The Republican Candidates
Other
Undecided
qapprove: Do you approve or disapprove of the way Donald Trump is handling his job as president? [Flip 1234 / 4321]
Strongly approve
Somewhat approve
Somewhat disapprove
Strongly disapprove
Unsure
qsex: The next set of questions are for statistical purposes only. Do you describe yourself as a man, a woman, or in some other way?
Man
Woman
Some other way
qyob: In what year were you born? Please respond with a four-digit year. [Ensure number, range 1901 - 2008]
qrace: Which of the following best describes your race and ethnic background?
African-American or Black
Asian-American, South-Asian, or Pacific Islander
Hispanic or Latino
Native American
White or Caucasian
More than one of the above
Other (please specify)
qeduc: What is the last year of education or degree you’ve finished?
1st through 11th grade
High School degree or GED
Technical or vocational school
Some college but no degree
Associate’s (2 year) degree
Bachelor’s (4 year) degree
Graduate or professional degree
qvote2024: [Randomly assign 50% of respondents to get following text: Regardless of how you feel about the candidates today, please think back to how you voted in the 2024 presidential election.] In the 2024 election for US President, for whom did you vote? [Rotate 1-2]
Democrat Kamala Harris
Republican Donald Trump
Libertarian Chase Oliver
Green Party candidate Jill Stein
Some other candidate (please specify)
Did not vote for President
Was not eligible to vote for President
qpid: And today, when it comes to politics, do you think of yourself as more of a … [Rotate 1-2]
Democrat
Republican
Independent
Something else
Unsure
qattention: How often do you pay attention to what’s going on in government and politics? All the time, most of the time, about half the time, once in a while, or never
All the time
Most of the time
About half the time
Once in a while
Never
Unsure
qpoltalk: In the past 12 months, how often did you discuss political, societal, or local issues with friends or family?
Basically every day
A few times a week
A few times a month
Once a month
Less than once a month
Not at all
Unsure
qidentity: How important is politics to your personal identity?
Extremely important
Very important
Somewhat important
Not too important
Not at all important
Unsure
qotherpolls: Sometimes, people answer multiple polls from different survey organizations. Besides this poll, how many polls have you answered in the last month? Please reply with a specific number, and if you cannot recall exactly, please just give your best guess.
qmip_open: In a few words, what are the most important issues in how you are deciding to vote this year? [open end]
qmip_closed1: [Text to web only] If you had to choose just one, which of the following issues is the most important in deciding how you will vote this year? [Randomize order, anchor last]
Jobs and the economy
The cost of living and inflation
Political corruption
The state of democracy
Healthcare
National security and international affairs
Lesbian, gay, and transgender rights
Crime
Artificial Intelligence
The environment and climate change
Race relations
Gun Rights
Taxes
Abortion
Drug use
Personal morality of the candidates
Other (please specify)
Unsure
qmip_closed2: [Text to web only] Which would you say is the second most important issue in deciding how you will vote this year? [Randomize order, anchor last]
Jobs and the economy
The cost of living and inflation
Political corruption
The state of democracy
Healthcare
National security and international affairs
Lesbian, gay, and transgender rights
Crime
Artificial Intelligence
The environment and climate change
Race relations
Gun Rights
Taxes
Abortion
Drug use
Personal morality of the candidates
Other (please specify)
Unsure
Fielding
The survey fielding was split across four modes. Cell phone numbers were contacted by text message, and respondents either completed the interview as a text-to-web survey (in which respondents self-administered an online survey after agreeing to participate) or a live interviewer text survey which took place entirely back and forth over text message. Landline numbers were contacted with one of two different automated phone interviewing tools, one “traditional” interactive voice response (IVR) tool, and one using an AI interviewer. Surveys were fielded from: Tuesday, October 27, 2026 through Sunday, November 1, 2026. The first day of fielding was a “soft launch” limiting the number of records. We then activated the DRASS sampling system to adjust for relative non-response across sampling strata.
After checking for duplicate responses, the final number of interviews, considered complete if answering through the party identification question, was as follows:
Kansas: 1,353 (1,330 cellphone, 23 landline)
Ohio: 1,174 (1,161 cellphone, 13 landline)
Maine: 1,342 (1,295 cellphone, 47 landline)
Minnesota: 1,423 (1,379 cellphone, 43 landline)
Weighting
We pooled the data together across modes and, within each state, raked the combined sample on the strata distribution in the sampling frame, educational attainment (self-reported), within-state region, 2024 recalled presidential vote, whether the respondent reported having already voted, and the proportion of registered voters in each state with a landline (of those with any phone number at all) in the L2 file. Education targets are derived from the 2024 CPS Voting and Registration Supplement. Region targets are derived from Census block-level aggregate voter registration counts using L2 data released by Redistricting Data Hub. Weighting targets for the 2024 presidential vote are derived from each state’s Secretary of State’s data and L2’s individual-level past voter participation data. Landline data is derived from the L2 voter file for each state. Early vote weighting targets reflect the proportion of the registered voter population that had voted early by the final day of fielding, with data coming from each state’s Secretary of State’s data and the United States Elections Project based at the University of Florida. Weights were rescaled to a mean of 1.
The distributions of weighting targets, unweighted data, and weighted data are available here:
Weighting targets, unweighted, and weighted distributions
Category
Target
Unweighted
Weighted
Age
18-29
14.9%
14.2%
15.3%
30-44
26.3%
21.5%
22.1%
45-64
32.5%
32.4%
29.2%
65+
26.3%
31.9%
33.4%
Sex
Female
52.3%
44.9%
44.4%
Male
46.6%
54.0%
54.9%
Other
1.0%
1.0%
0.7%
Education
College
39.8%
49.7%
39.9%
Non-college
60.2%
50.3%
60.1%
Race/ethnicity
White
83.1%
82.0%
81.6%
Black
4.1%
3.5%
3.0%
Hispanic
7.1%
5.2%
5.0%
Other
5.7%
9.2%
10.3%
Region
Kansas City & Kaw Valley
41.2%
41.8%
41.2%
Rural Kansas
37.0%
34.6%
37.0%
Wichita Metro
21.8%
23.6%
21.8%
2024 presidential vote
Trump
38.6%
28.1%
38.6%
Harris
27.7%
36.8%
27.7%
Did not vote
32.4%
32.2%
32.4%
Other
1.2%
3.0%
1.2%
Already voted in 2026
Not yet voted
81.5%
67.6%
81.5%
Already voted
18.5%
32.4%
18.5%
Phone type
Cell
89.6%
98.3%
89.6%
Landline
10.4%
1.7%
10.4%
Category
Target
Unweighted
Weighted
Age
18-29
14.4%
5.7%
6.1%
30-44
24.9%
21.2%
20.6%
45-64
32.6%
36.2%
32.3%
65+
28.1%
36.9%
41.0%
Sex
Female
49.9%
48.5%
46.2%
Male
48.7%
50.1%
52.8%
Other
1.4%
1.4%
1.1%
Education
College
38.4%
53.1%
38.4%
Non-college
61.6%
46.9%
61.6%
Race/ethnicity
White
80.2%
83.3%
86.0%
Black
12.6%
7.2%
6.9%
Hispanic
3.0%
1.9%
1.6%
Other
4.2%
7.7%
5.5%
Region
Miami Valley
18.9%
19.0%
18.9%
Eastern
18.3%
17.0%
18.3%
Cleveland
18.3%
17.8%
18.3%
Central
14.7%
16.2%
14.7%
Columbus
13.0%
14.2%
13.0%
Northwest
8.5%
8.7%
8.5%
Appalachia
8.3%
7.1%
8.3%
2024 presidential vote
Trump
40.5%
27.6%
40.5%
Harris
32.2%
43.5%
32.2%
Did not vote
26.6%
26.8%
26.6%
Other
0.7%
2.0%
0.7%
Already voted in 2026
Not yet voted
79.1%
60.7%
79.1%
Already voted
20.9%
39.3%
20.9%
Phone type
Cell
87.3%
98.9%
87.3%
Landline
12.7%
1.1%
12.7%
Category
Target
Unweighted
Weighted
Age
18-29
10.6%
4.3%
5.8%
30-44
23.3%
15.6%
18.8%
45-64
29.4%
33.3%
29.1%
65+
36.8%
46.8%
46.4%
Sex
Female
50.3%
49.6%
49.1%
Male
48.8%
49.6%
49.6%
Other
0.9%
0.9%
1.3%
Education
College
38.1%
58.0%
38.1%
Non-college
61.9%
42.0%
61.9%
Race/ethnicity
White
94.6%
92.3%
91.5%
Black
0.6%
0.7%
0.6%
Hispanic
1.2%
1.3%
1.1%
Other
3.7%
5.7%
6.8%
Region
CD1
51.4%
56.1%
51.4%
CD2
48.6%
43.9%
48.6%
2024 presidential vote
Trump
37.3%
32.0%
37.3%
Harris
43.0%
47.5%
43.0%
Did not vote
17.8%
17.7%
17.8%
Other
1.7%
2.7%
1.7%
No answer
0.1%
0.1%
0.1%
Already voted in 2026
Not yet voted
67.8%
54.8%
67.8%
Already voted
32.2%
45.2%
32.2%
Phone type
Cell
82.3%
96.5%
82.3%
Landline
17.7%
3.5%
17.7%
Category
Target
Unweighted
Weighted
Age
18-29
16.2%
14.3%
13.5%
30-44
26.0%
25.4%
22.1%
45-64
31.0%
31.6%
31.2%
65+
26.9%
28.7%
33.2%
Sex
Female
50.6%
43.2%
41.2%
Male
46.6%
54.0%
56.7%
Other
2.8%
2.8%
2.2%
Education
College
41.8%
55.9%
41.8%
Non-college
58.1%
44.1%
58.1%
No answer
0.1%
0.1%
0.1%
Race/ethnicity
White
82.7%
84.2%
80.4%
Black
4.4%
4.2%
4.8%
Asian/Pacific Islander
4.5%
1.8%
1.6%
Hispanic
2.3%
2.4%
1.9%
Other
6.0%
7.4%
11.2%
Region
Twin Cities
31.1%
38.1%
31.1%
Twin Suburbs
24.4%
21.7%
24.4%
Greater Minnesota
24.4%
24.5%
24.4%
Southeast
12.9%
8.6%
12.9%
Iron Range
7.2%
7.1%
7.2%
2024 presidential vote
Trump
37.9%
27.1%
37.9%
Harris
41.3%
46.5%
41.3%
Did not vote
19.1%
24.3%
19.1%
Other
1.6%
2.1%
1.6%
No answer
0.1%
0.1%
0.1%
Already voted in 2026
Not yet voted
81.3%
70.6%
81.3%
Already voted
18.6%
29.4%
18.6%
No answer
0.1%
0.1%
0.1%
Phone type
Cell
84.1%
96.9%
84.1%
Landline
15.9%
3.1%
15.9%
After accounting for the design effect from weighting, the margin of error:
Likely voters were identified among the registered voters interviewed through a combination of self-reported turnout and vote history in the 2024 and 2022 November general elections.
Other Disclosures
This survey of registered voters in the United States was paid for by Survey 160 as part of our ongoing methodological research initiatives. All estimates of public opinion have sources of error beyond that which is captured by the margin of error, including non-ignorable (post weighting) non-response error, frame and coverage error, measurement error and processing error. Artificial Intelligence tools were used in one of the fielding methods as described above. Additionally, other AI-based tools were used to help draft and review analysis code and tables, review the draft of the questionnaire against best practices, and perform quality assurance checks to ensure the survey as programmed matched the written questionnaire, but all analysis was ultimately performed by human staff.