
Comparing and Combining Text-to-Web and Panel-to-Web Surveys (Part 1)
Kevin Collins, Survey 160
Last week at the annual meeting of the American Association for Public Opinion Research, we presented on internal research conducted just before the November 2024 election.
Despite being focused on using text messages to field surveys, the vast majority of research we do for clients is part of mixed mode projects, which is why we have been engaged in a multi-year research agenda to identify best practices for combining data across modes. For example, at last year’s AAPOR conference we presented research on comparing and combining text messages with phone surveys conducted in 2023.
Building on that research agenda, in the week before the 2024 elections, we ran concurrent surveys in Arizona, North Carolina, and Pennsylvania: one via text-to-web, and one using a voter-file-matched online panel survey. We compared the samples, the weighted estimates derived from them, and different ways to combine the data together.
In this blog post, we summarize that research, including why we think these are complementary modes, and also “one weird trick” to make the estimates from the panel (and joint) estimates more accurate on average.
Takeaway #1: The matched panel was cheaper, but failed to hit target sample sizes.
A primary appeal of online panel surveys is their comparatively low cost. And indeed, that was the case. In this particular study, the average cost of text surveys (with two rounds of attempts) was $11.29, about twice the price of the $6.10 we paid per voter-file-matched panel survey interview (unmatched responses are generally even cheaper). But while we aimed to collect 500 panel-to-web and 600 text-to-web interviews in each state, the panel failed to hit targets in two of the three states surveyed.
Takeaway #2: Panelists were more professional (for better and worse)
Also as expected, we saw more “professional survey takers” in the panel-to-web survey. This manifested in several ways.
Panelists were far more likely to complete the survey in less than half the median time to complete the survey.

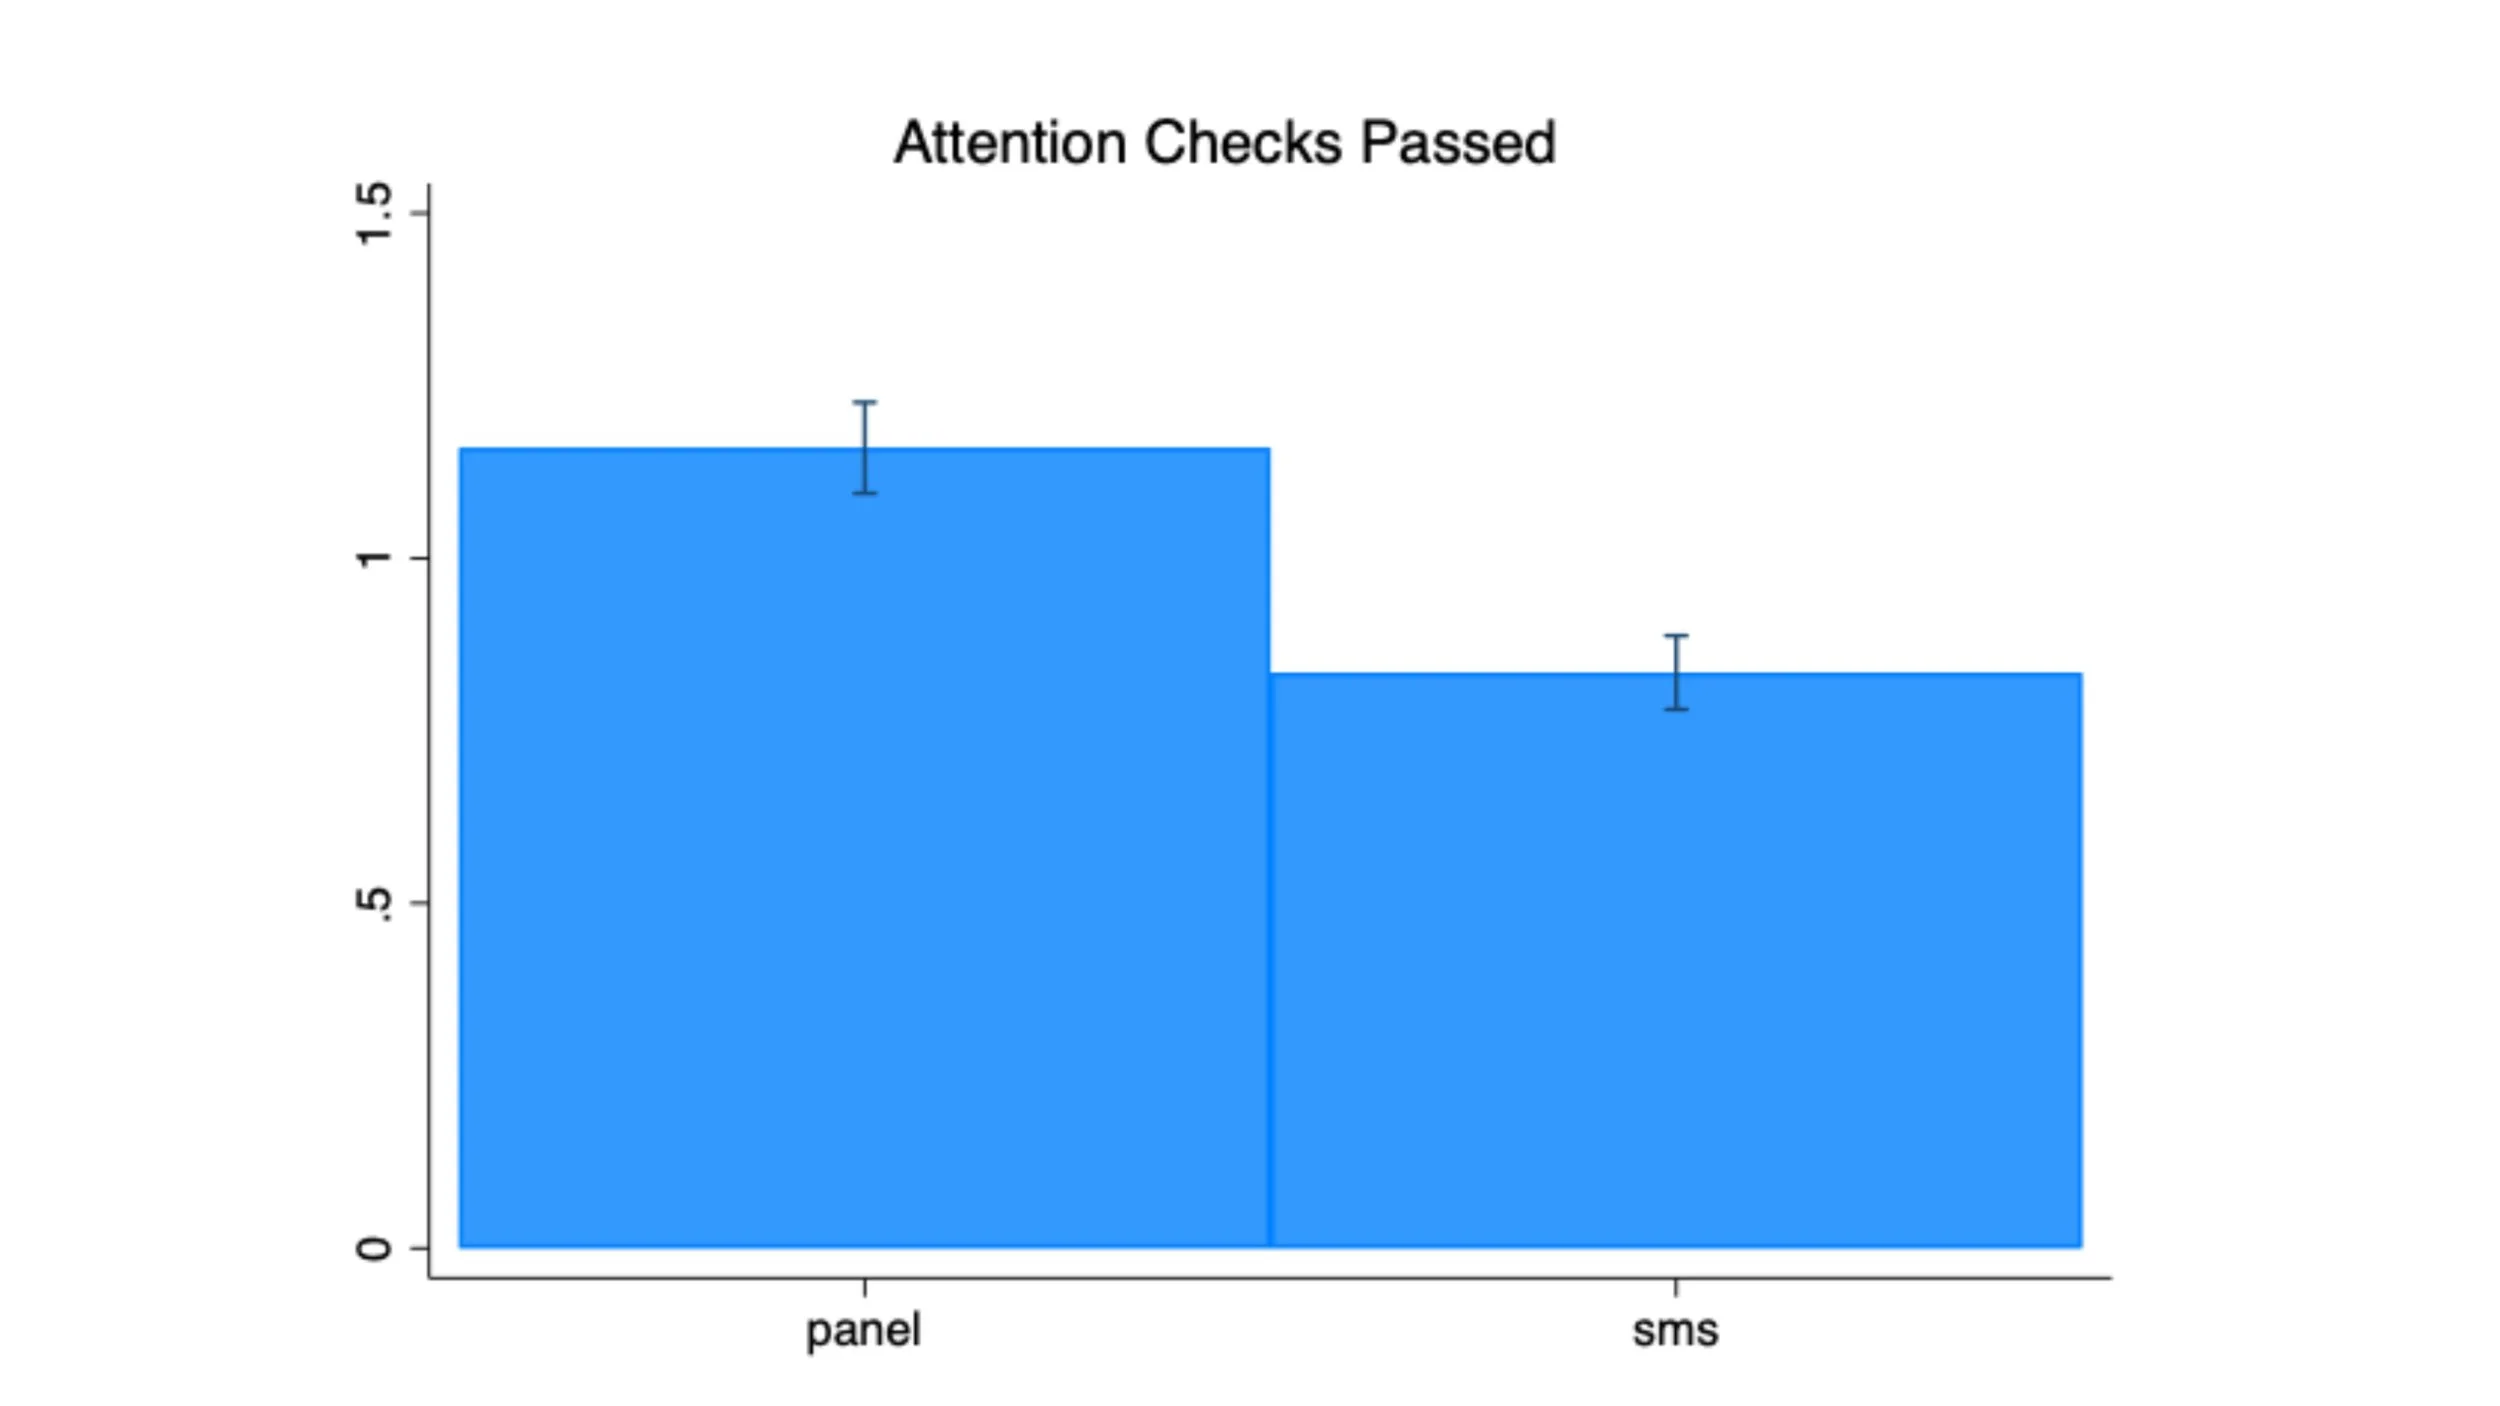
Panel respondents also passed more of the three directed-response attention checks on average, perhaps because they were more accustomed to seeing those kinds of questions (or were actively looking for them). That said, there was no meaningful or statistically significant difference in the proportion of respondents straightlining in responses to a candidate favorability battery.
But the biggest sign of professionalism may be responses to the question “Sometimes, people answer multiple polls from different survey organizations. Besides this poll, how many polls about the 2024 election have you answered in the last month?” The panel-to-web respondents were far less likely to answer “no other polls” or “one other poll”, and far more to give a response to the categories five or more. Other polls.

And this difference turns out to be the key to one strategy to making panel respondents more accurate, a topic that we will take up in part II in two weeks.
Methodological Details
The surveys were fielded October 28 - November 4, 2024 in Arizona, North Carolina, and Pennsylvania. Sample sizes by each mode are below.
| Panel-to-Web | Text-to-Web | |
|---|---|---|
| AZ | 316 | 634 |
| NC | 426 | 684 |
| PA | 540 | 631 |
We applied a common weighting scheme built around our sample stratification approach for the text-to-web surveys, which used race, age, gender, past turnout history in general and primary elections, and party registration. Additionally in PA we applied weights for self-reported educational attainment using 2022 Current Population Survey registered voter estimates as a target, as the weighted estimates of education were misaligned without this additional adjustment
The composite index of political engagement is constructed out of the following individual variables, all based on self-reports except for 2020 turnout.
2020 Turnout (primary and general)
Self-report already having voted in 2024
Self-reports of having donated to a candidate, posted about politics on social media, political interest, and frequency of political talk
Reporting candidate choice (not unsure)
Folded rating scales averaged across 5 candidates, so most extreme evaluations = 1
Share of 5 candidates that respondents can rate
“Consistent Partisan” 1-5 point scale, folded