
Comparing and Combining Text-to-Web and Panel-to-Web Surveys (Part 2)
Kevin Collins, Survey 160
In our last blog post, we described an experiment we conducted in 2024 and presented at AAPOR this past May to compare (and test strategies for combining) text-to-web and panel-to-web data. We found that the matched panel product we used was less expensive than text-to-web, but struggled to hit target numbers of completed interviews in two of the three mid-sized states included in the study. Panel respondents were more professional, meaning both they answered much more quickly but also passed attention checks at somewhat higher rates, and reported taking many more other surveys on average. But panel respondents were also less likely to report having a college degree and were less politically engaged.
Now we turn to the core question: accuracy.
Takeaway #4: Weighted Text-to-Web estimates are more accurate, with less Democratic bias, than Panel-to-Web estimates.
After weighting (see methodological details at end), we derived estimates for three contests in each of the three states. We asked about the presidential election in all three states. Additionally, in Arizona we asked about the election for US Senate and the state ballot initiative to protect abortion rights. In North Carolina we asked about the contest for Governor and Lieutenant Governor. And in Pennsylvania we asked about the race for US Senate and Attorney General. Then we compared these weighted estimates for text-to-web (SMS) and the panel-to-web surveys to the actual election results, computing the both absolute error and “signed” error, or bias.
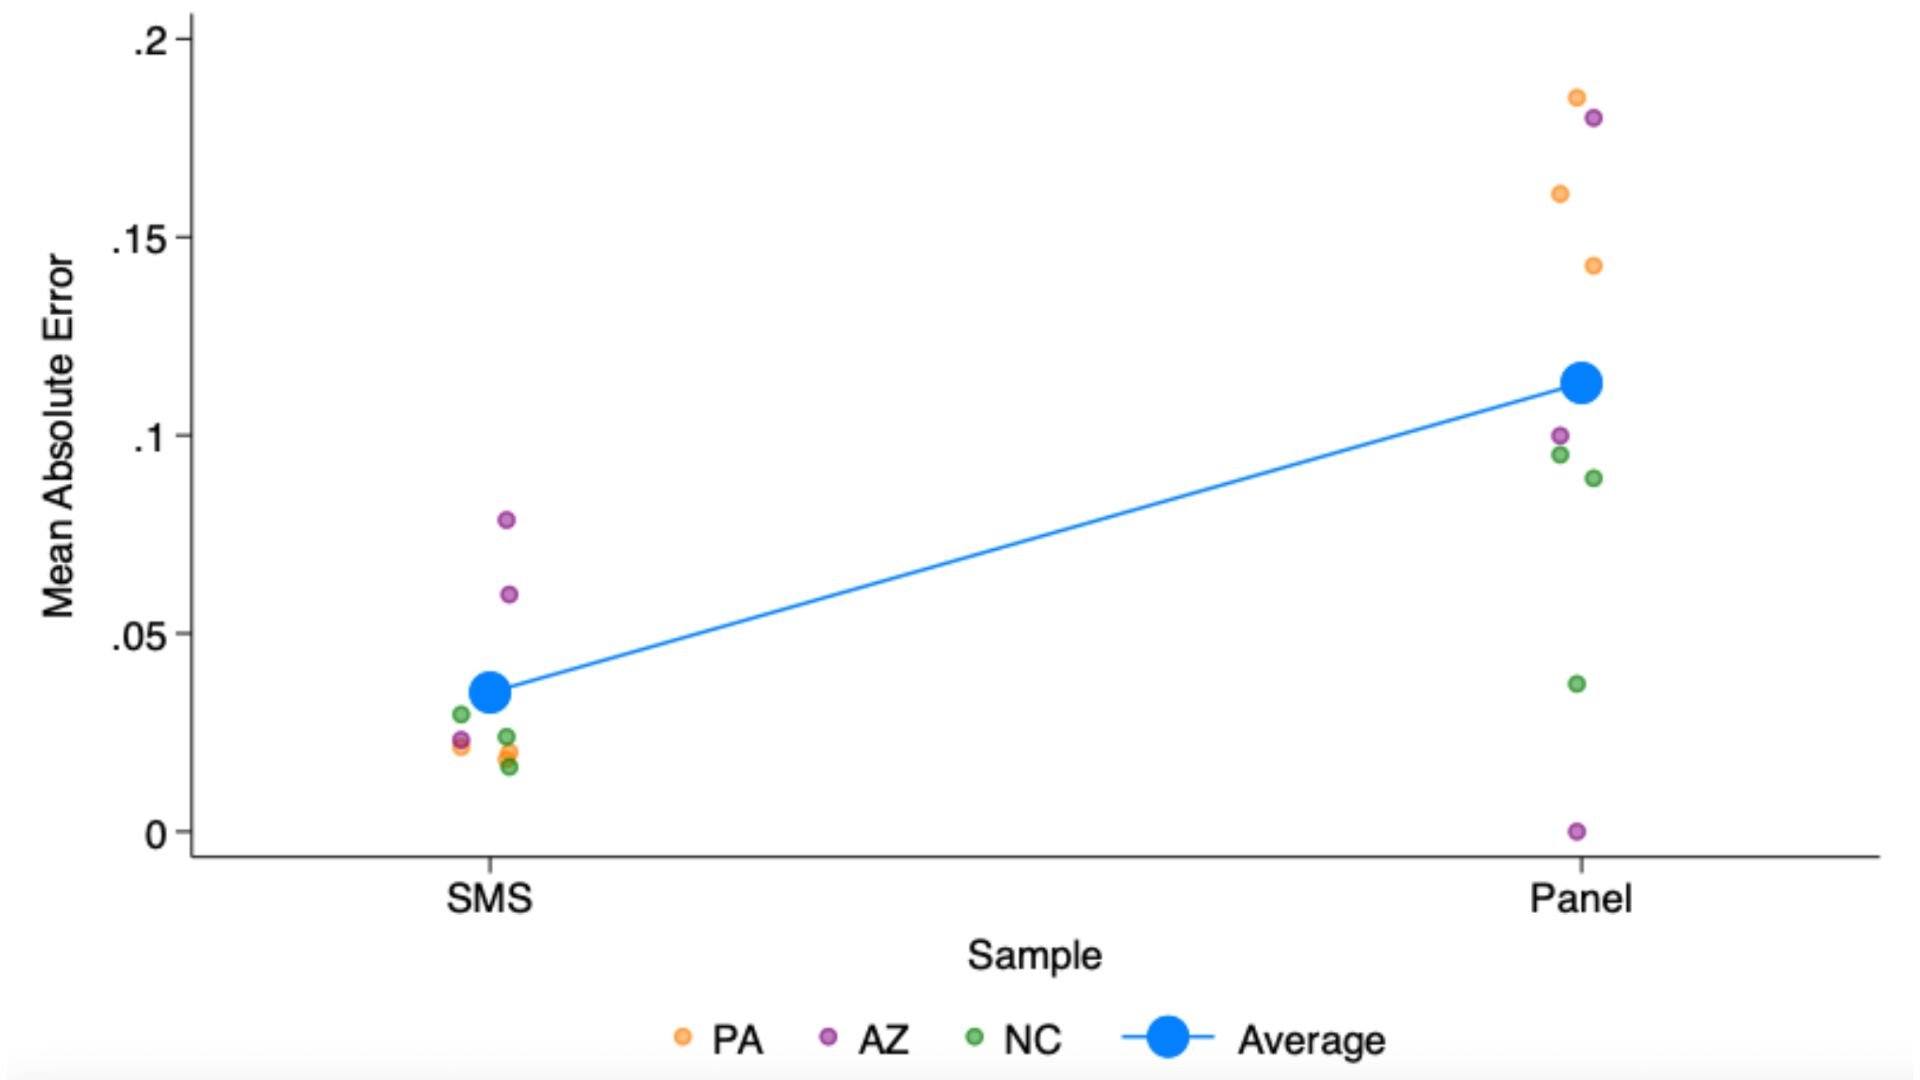

While not every contest estimate is more accurate in the text-to-web estimates than the panel estimates, we find that on average the SMS has lower absolute error and very close to exactly 0 bias. There’s also less variance in the accuracy of the estimates.
Takeaway #5: If we use the text-to-web surveys to estimate the “right” proportion of previous surveys, and use that as a weighting factor, we can make the panel estimates more accurate.
As described earlier, there are too many habitual survey takers, or professional respondents, among the panelists, at least as compared to what we would expect from the text-to-web probability survey. Using probability surveys to calibrate estimates from non-probability opt-in online panels is a well established technique, though more often that involves much larger non-probability than probability samples, while the reverse is true here. That difference makes some of the common approaches used to do such calibration infeasible.
So we instead tried to downweight the professional respondents to match the text-to-web responses, first estimating the correct distribution (combining some of the top categories) from the text-to-web weighted estimates, and then adding this distribution to the weighting targets for panelists.
The resulting set of estimates, which we call the “calibrated panel” lowered the absolute error and bias relative to the panel estimates:


Takeaway #6: The same “one weird trick” of weighting down professional respondents in panel data using targets from probability text-to-web sample also makes multi-modal estimates more accurate
Also importantly, it lowered the error and bias of the estimates derived from combining the text-to-web and panel-to-web data. We tried this three ways: throwing all the data together then weighting, weighting separately and then combining, and weighting the SMS, then using those estimates to weight the panel as described above. The last approach clearly performed the best, both lowering the average error and bias, as well as reducing the variance in the error.


This improvement came both by making the panel estimates more accurate (as noted above) but also by lowering the weight given to the panel in the combined estimates, because the professional respondents were sharply downweighted.
Next Steps
We are continuing our ongoing efforts to identify best practices for multimodal research using text messages, from alternative fielding strategies to different approaches to weighting and calibration. If you are interested in partnering with us in those efforts, please reach out by email at info@survey160.com.
Methodological Details
The surveys were fielded October 28 - November 4, 2024 in Arizona, North Carolina, and Pennsylvania. Sample sizes by each mode are below.
| Panel-to-Web | Text-to-Web | |
|---|---|---|
| AZ | 316 | 634 |
| NC | 426 | 684 |
| PA | 540 | 631 |
We applied a common weighting scheme built around our sample stratification approach for the text-to-web surveys, which used race, age, gender, past turnout history in general and primary elections, and party registration. Additionally in PA we applied weights for self-reported educational attainment using 2022 Current Population Survey registered voter estimates as a target, as the weighted estimates of education were misaligned without this additional adjustment.