
Survey 160 Tracking Poll, April 2026
By Pedro Antenucci and Kevin Collins
Today, we are releasing the results from our ongoing Survey 160 tracking poll conducted between April 8 and April 13. In addition to our continued research on presidential approval and the congressional generic ballot, this poll introduces a new experiment to test how exposure to recent news stories involving specific political figures affects voters' baseline perceptions of party corruption.
Presidential Approval and Generic Congressional Ballot
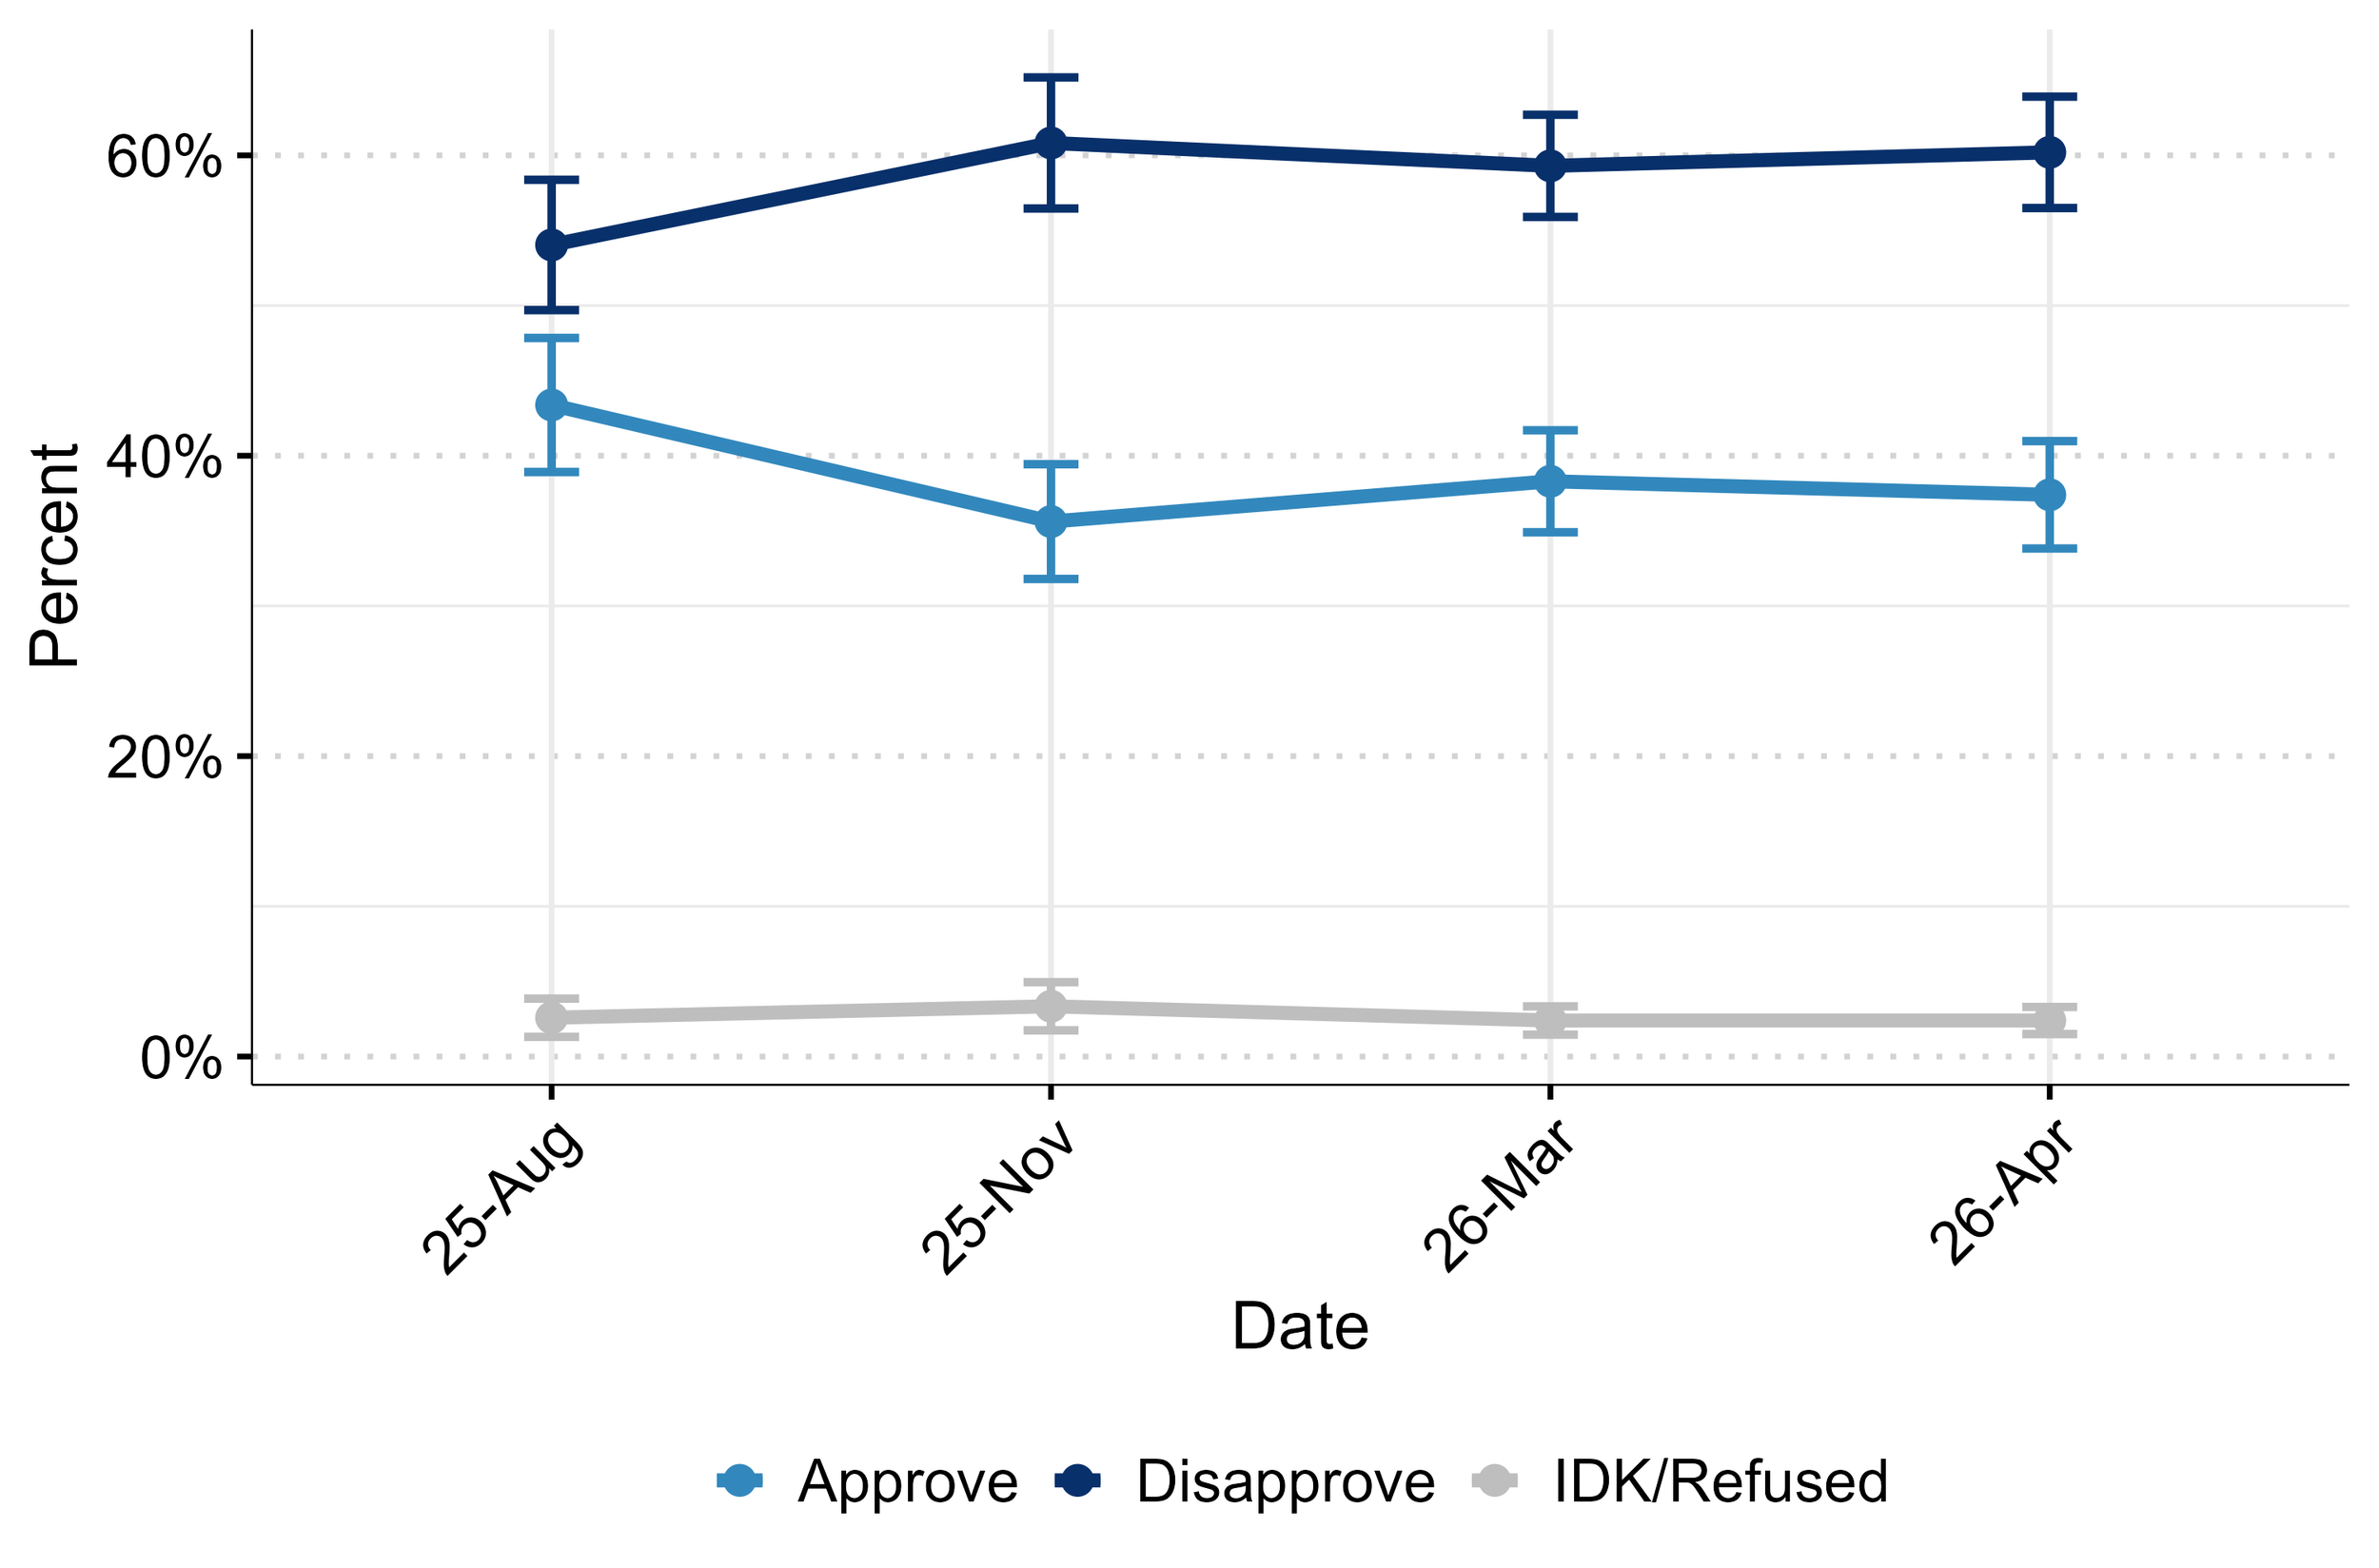
In a mixed mode text-to-web and online panel survey of 1,539 registered voters nationwide (see full methodological details at the bottom of this blog post), we find that Donald Trump’s approval has changed only slightly since our last poll. 37% of respondents somewhat or strongly approve of the way Trump is handling his job as president (slightly down from 38% last poll), while 60% of respondents either somewhat or strongly disapprove (marginally up from 59% last poll).
Presidential Approval over Four Survey Waves
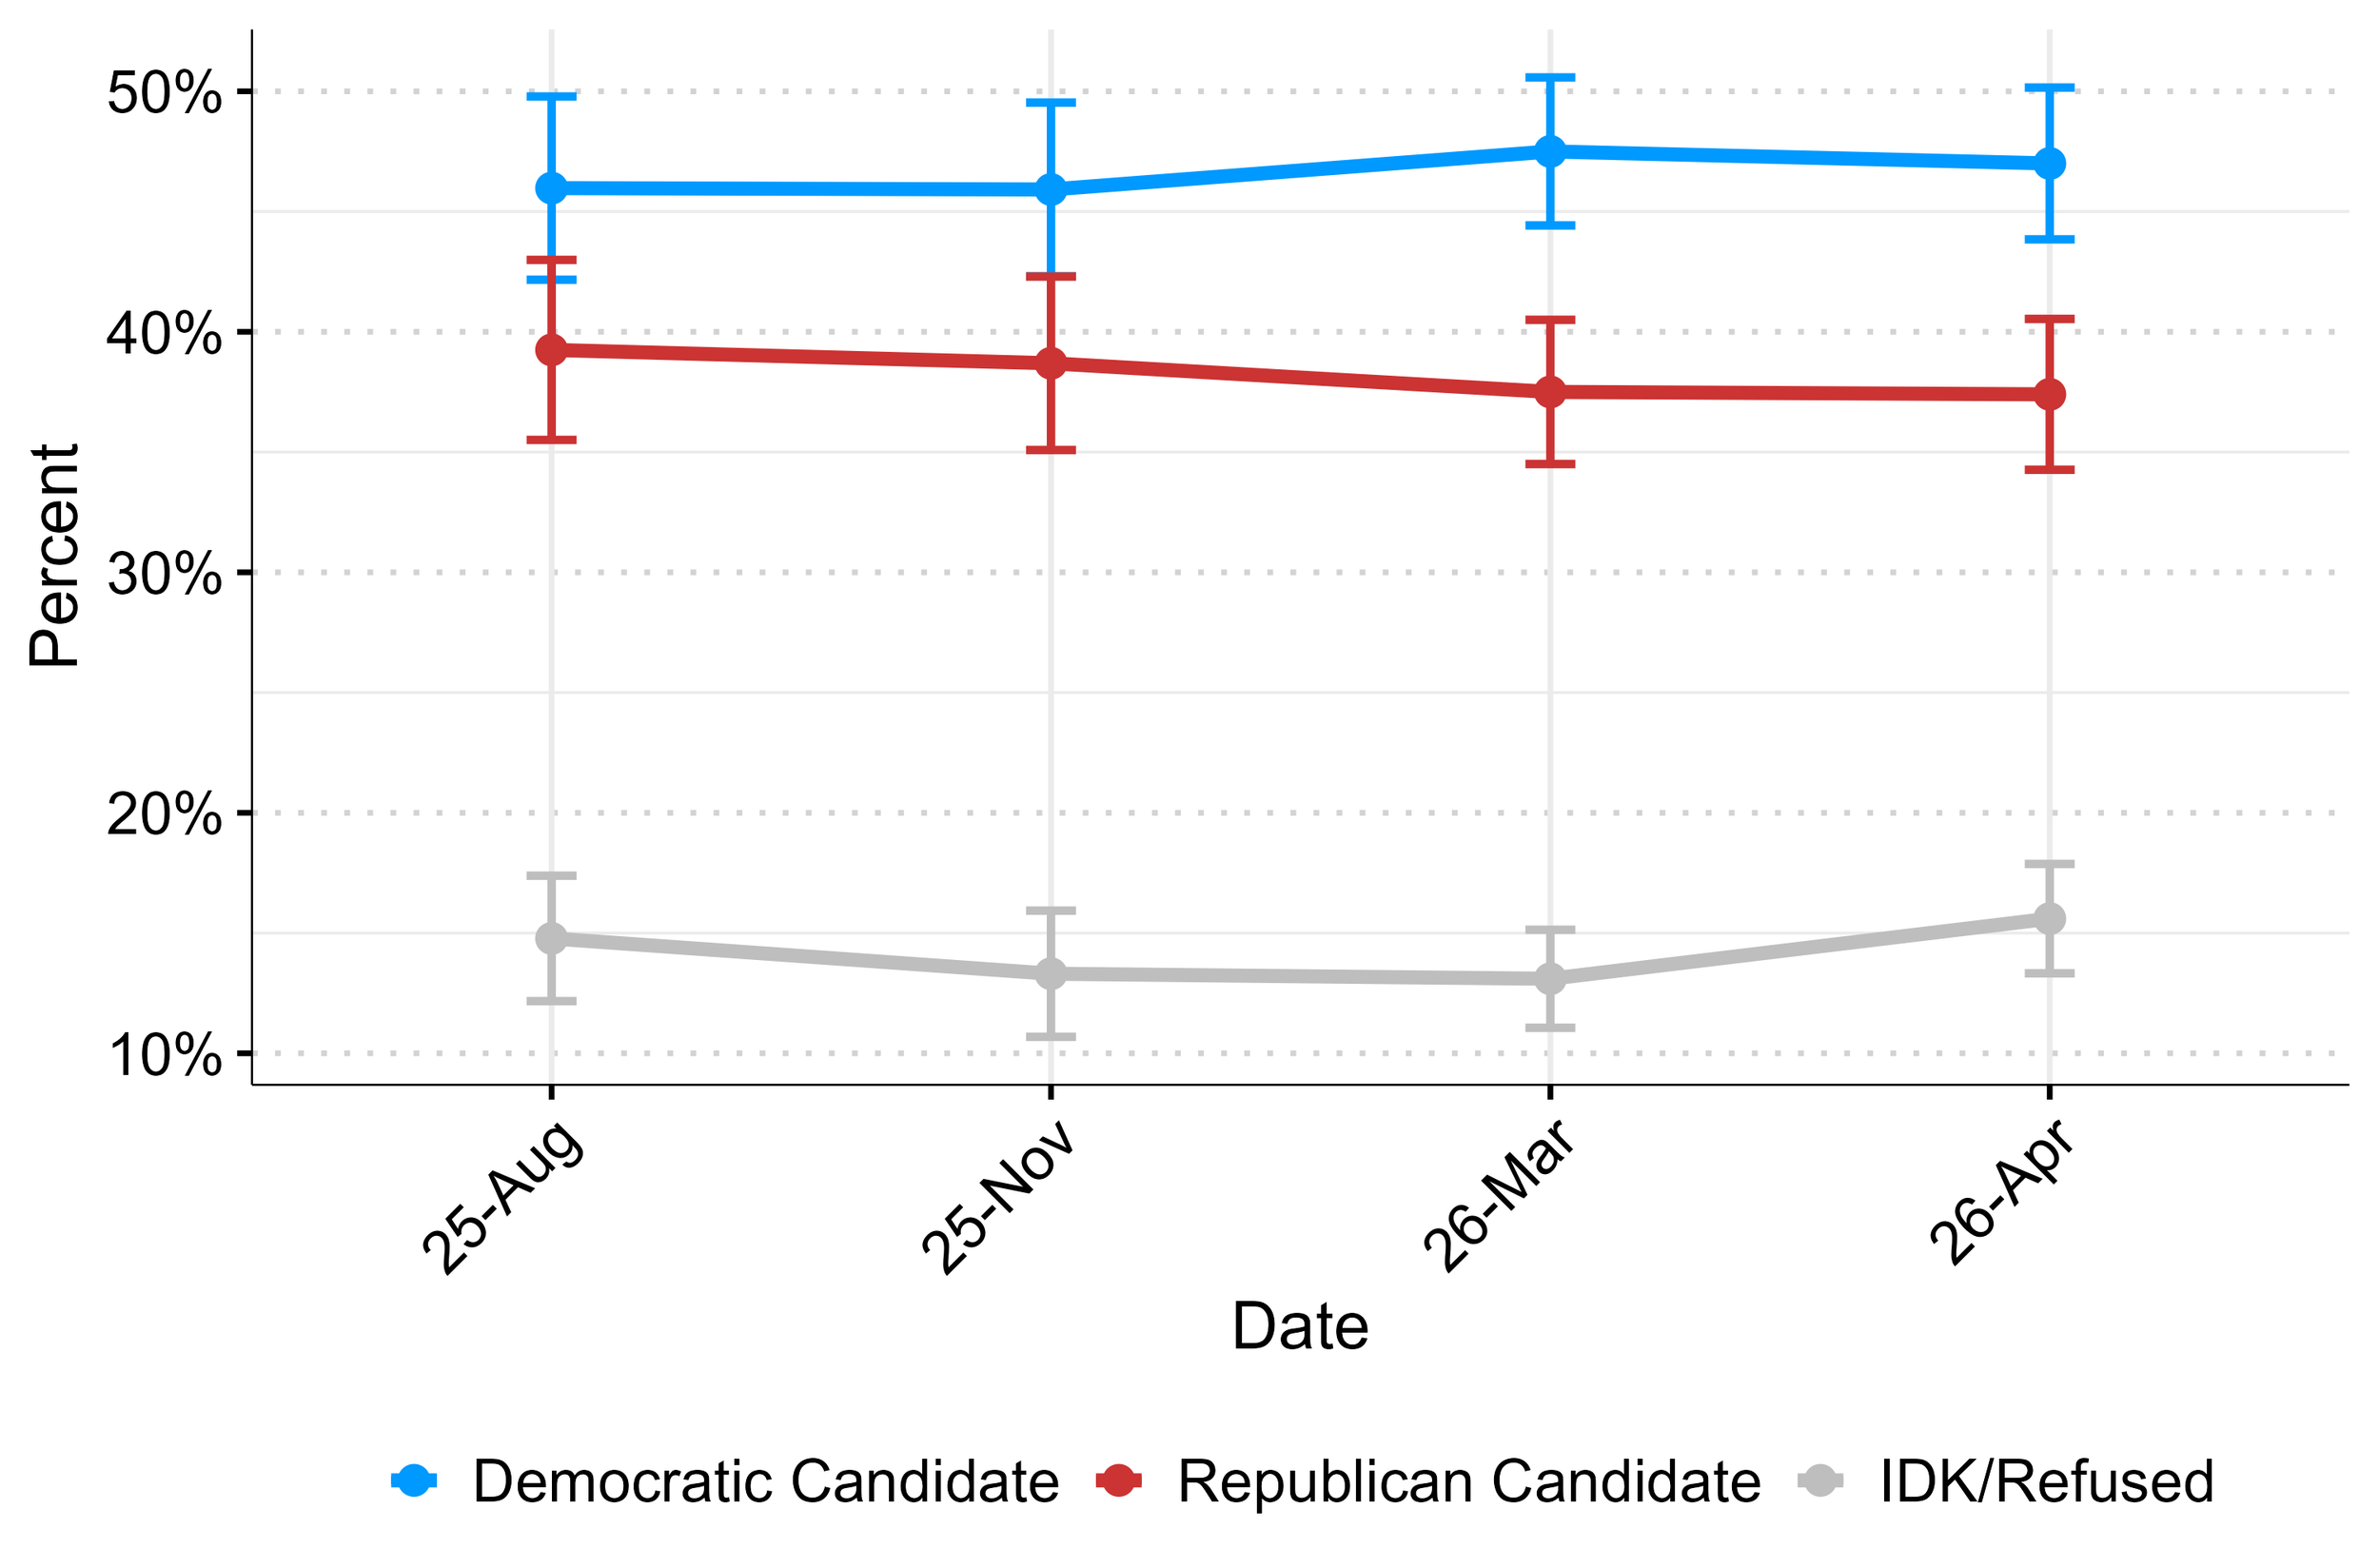
Our last Survey 160 tracking poll showed Democrats with a 10-point lead in the generic ballot for the US House – and that lead remains steady at 10 points in our latest poll. Overall, 47% of voters favor the Democratic candidate, 37% favor the Republican candidate, and 16% remain unsure or refused to answer.
Looking at the crosstabs, the partisan lines remain firmly drawn: 94% of Democrats support the Democratic candidate, while 87% of Republicans support the Republican candidate. Support among independent voters also remains largely stable. In March, 53% of independents preferred Democratic candidates, 21% preferred Republican candidates, and 25% were undecided. By April, that stood at 51% for Democratic candidates and 22% for Republican candidates, with the remaining 27% undecided.
Full question wording and crosstabs are available below.
Generic Congressional Ballot Preference over Four Survey Waves
Perception of Public Corruption
Turning to the topic of public corruption, we continued our experimental research to see how perceptions of the two major political parties are shaped by exposure to specific policy and news information.
In previous surveys, we tested the impact of a single news story on party perceptions. This month, we expanded this into a multi-story "dose-response" experiment to see how cumulative exposure to different corruption scandals affects baseline partisan views, including stories of corruption by Democratic elected officials.
In this study, respondents were randomly presented with three recent news events that media reports have called corrupt and asked to evaluate whether they viewed each event as very corrupt, somewhat corrupt, not very corrupt, or not at all corrupt. The three vignettes exposed to any particular respondent were drawn randomly from a pool of six real-world events:
Two Democratic vignettes: The indictments of Rep. Henry Cuellar and conviction of Sen. Bob Menendez on bribery charges.
Four Republican vignettes: Donald Trump’s pardon of Binance founder Changpeng Zhao, Trump's fundraising pitch to oil industry executives, alleged insider trading in oil futures prior to a Trump announcement on Iran, and Sen. Steve Daines' last-minute withdrawal to favor a handpicked successor.
The full text of these vignettes is in the questionnaire at the bottom of the blog post. To measure the impact of these stories, half of our respondents (the control group) were asked our standard tracking question—"Who do you think is more corrupt?"—before evaluating the news stories. The other half (the treatment group) were asked the party corruption question after reading and evaluating their three randomly assigned stories.
To preview the results, we found that
Exposing respondents to vignettes about corruption shaped who they thought was more corrupt, including among partisans
The effects varied by story of corruption, with some moving attitudes more strongly than others
The “dose-response” relationship, in terms of the share of stories that are about the GOP, is noisy at best, suggesting that which stories are included matter more than the volume
The effect of the story on in-party attitudes cannot easily be predicted from those partisans’ assessment of the seriousness of corruption in the vignette
Effect of Individual Stories
First, we isolated the marginal effect of each specific story to see if certain scandals resonated more powerfully than others.
Marginal Effects of Individual Scandal Stories on Corruption Perceptions
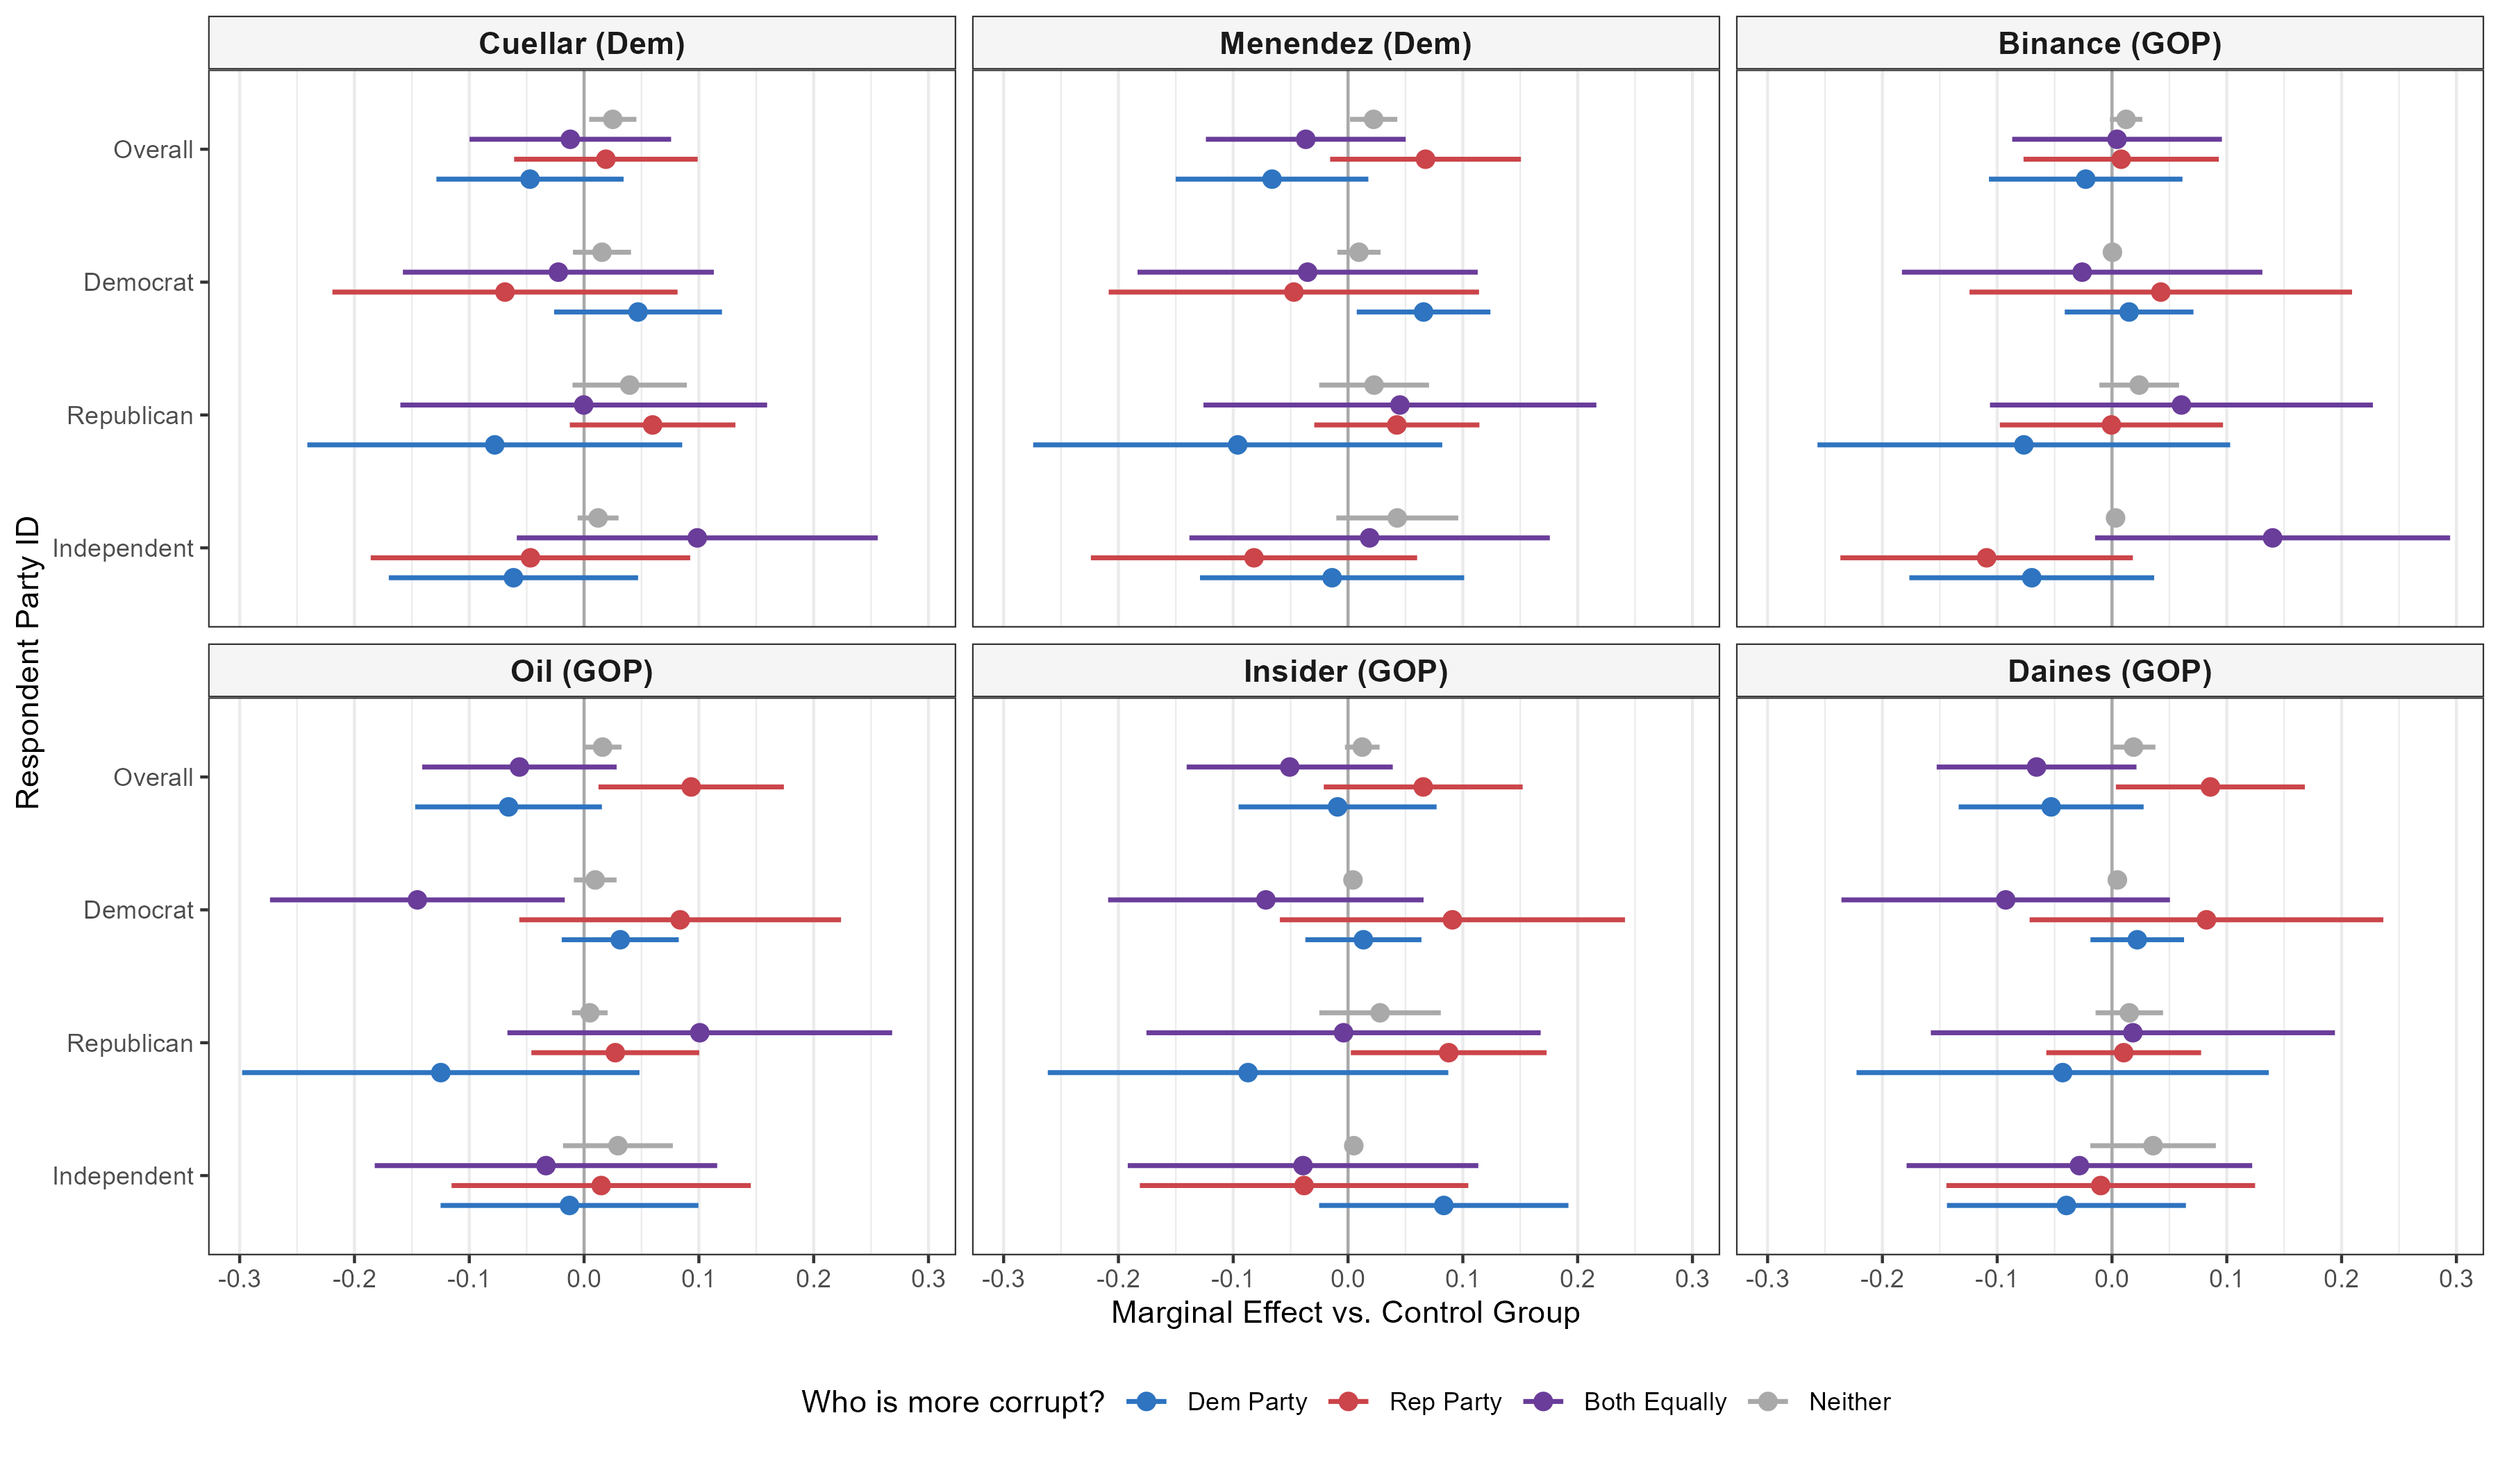
To test this, we used a linear regression, limiting to the half of cases in which that story was presented to respondents (either before or after the question about corruption. That regression also controlled for which other stories were presented. We found that not all scandals have the same effect. The Oil Industry fundraising story had the strongest independent effect, shifting overall voters to view the Republican Party as more corrupt by 9.3 percentage points (p<0.05). The Steve Daines ballot maneuvering story also resonated, shifting that same metric by 8.6 points (p<0.05). Meanwhile, stories like the Binance Pardon produced virtually no statistically significant movement, shifting views on Republican corruption by less than a single point (0.8 pp), which is somewhat surprising given our earlier experiment on that same topic.
Looking at the effect of the Democratic stories on Democratic voters, we see that Democrats are persuadable when confronted with specific evidence against their own side. Exposure to the Bob Menendez bribery story clearly had a positive effect on co-partisan blame, significantly increasing the perception among Democrats that the Democratic Party is more corrupt by 6.6 percentage points (p<0.05). The Henry Cuellar indictment story similarly pushed Democrats to view their own party as more corrupt by 4.7 percentage points, though this shift was not statistically significant in this sample.
Dose-Response Relationship
Because the three stories were drawn randomly from a pool weighted toward Republican events, respondents naturally received different "dosages" of partisan news. Some saw one Republican story and two Democratic stories, while others saw up to three Republican stories and zero Democratic stories. Given the distribution of story types, there were 20 possible combinations of stories: four with only Republican vignettes, twelve with one Democratic vignette and two Republican vignettes, and four with two Democratic vignettes and one Republican vignette.
Before getting into the dose-response or heterogeneity, it is useful to look at the overall effect of any treatment versus the control group. Overall, comparing all respondents who received any treatment combination to the all-control group, we saw that exposing respondents to this mix of vignettes shifted the baseline. It increased the perception that Republicans are more corrupt by 5.3 percentage points (p<0.1) and decreased the perception that Democrats are more corrupt by 4.4 percentage points, though this shift was not statistically significant.
Next, we looked at the predicted probabilities of how voters viewed party corruption based on the "dose" of Republican stories they received compared to the control group.
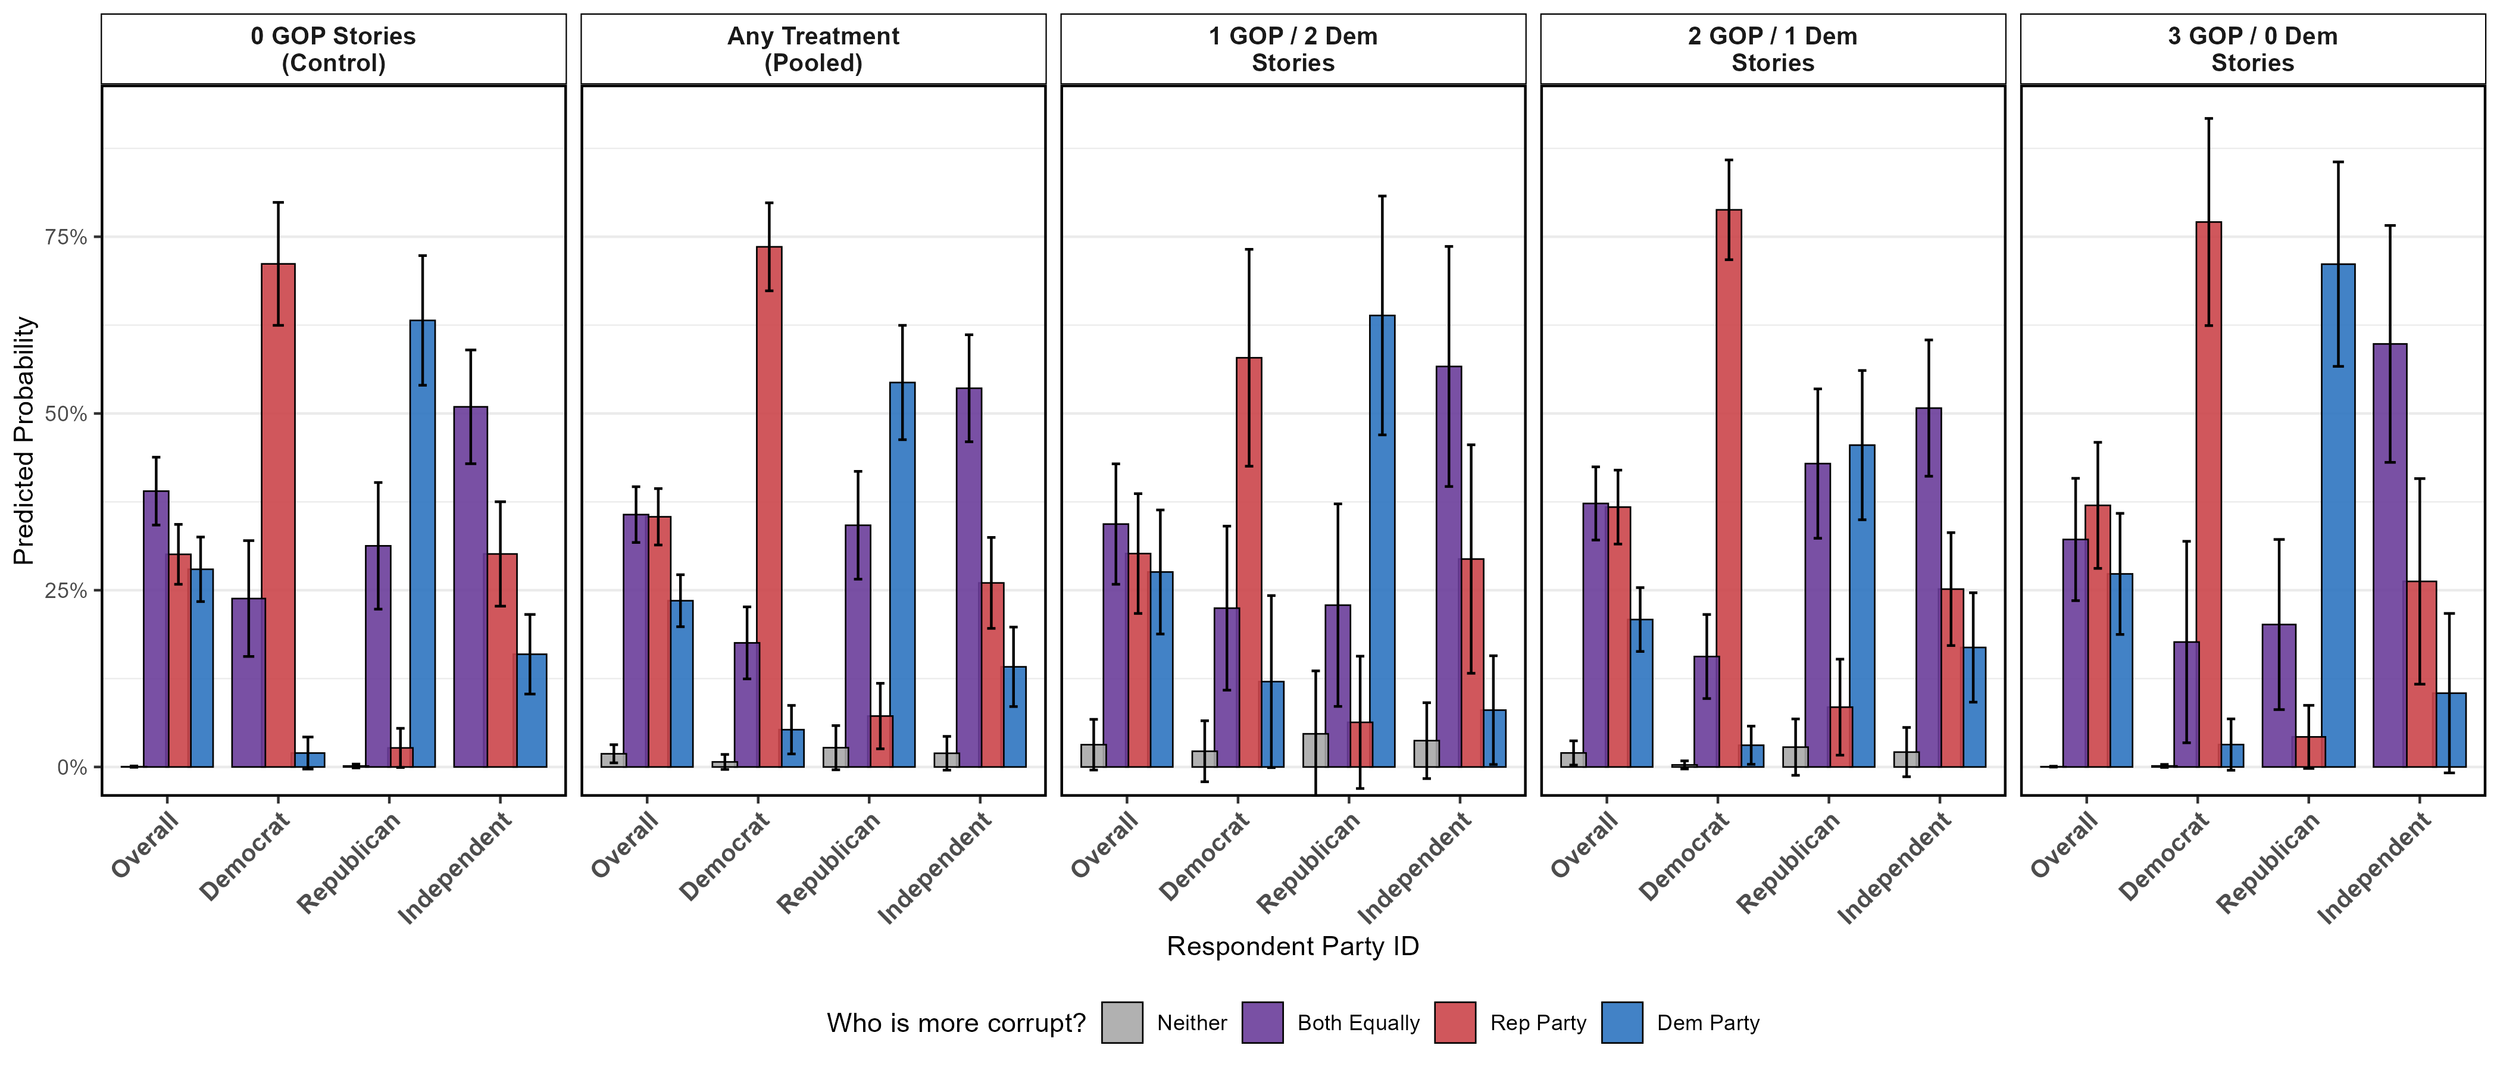
Turning to the dose-response relationship, the data shows that a mixed, high dosage of GOP stories successfully moved the needle. Receiving 2 GOP stories (and 1 Democratic story) shifted voters away from viewing the Democratic Party as more corrupt (a drop of 7.1 percentage points, p<0.05) and increased the likelihood of viewing the Republican Party as more corrupt by 6.7 points (p<0.1).
Disaggregating by party identification, we see heterogeneity similar to what we have seen in previous experiments on this topic. For Democrats, seeing a mixed dosage of 1 GOP and 2 Democratic stories decreased the likelihood they would identify the Republican party as more corrupt by 13.3 percentage points compared to the control group. Conversely, among Republicans, exposure to 2 GOP stories and 1 Democratic story shifted them away from viewing Democrats as more corrupt—17.6 percentage point drop (p<0.05)—and pushed them toward the "both are equally corrupt" option by 11.6 points.
Predicting Effects from Assessment of Corruption in a Vignette
Finally, we wanted to test a specific methodological question: Can a simple assessment of the level of corruption predict the effect on the attitudes of partisans towards their own party?
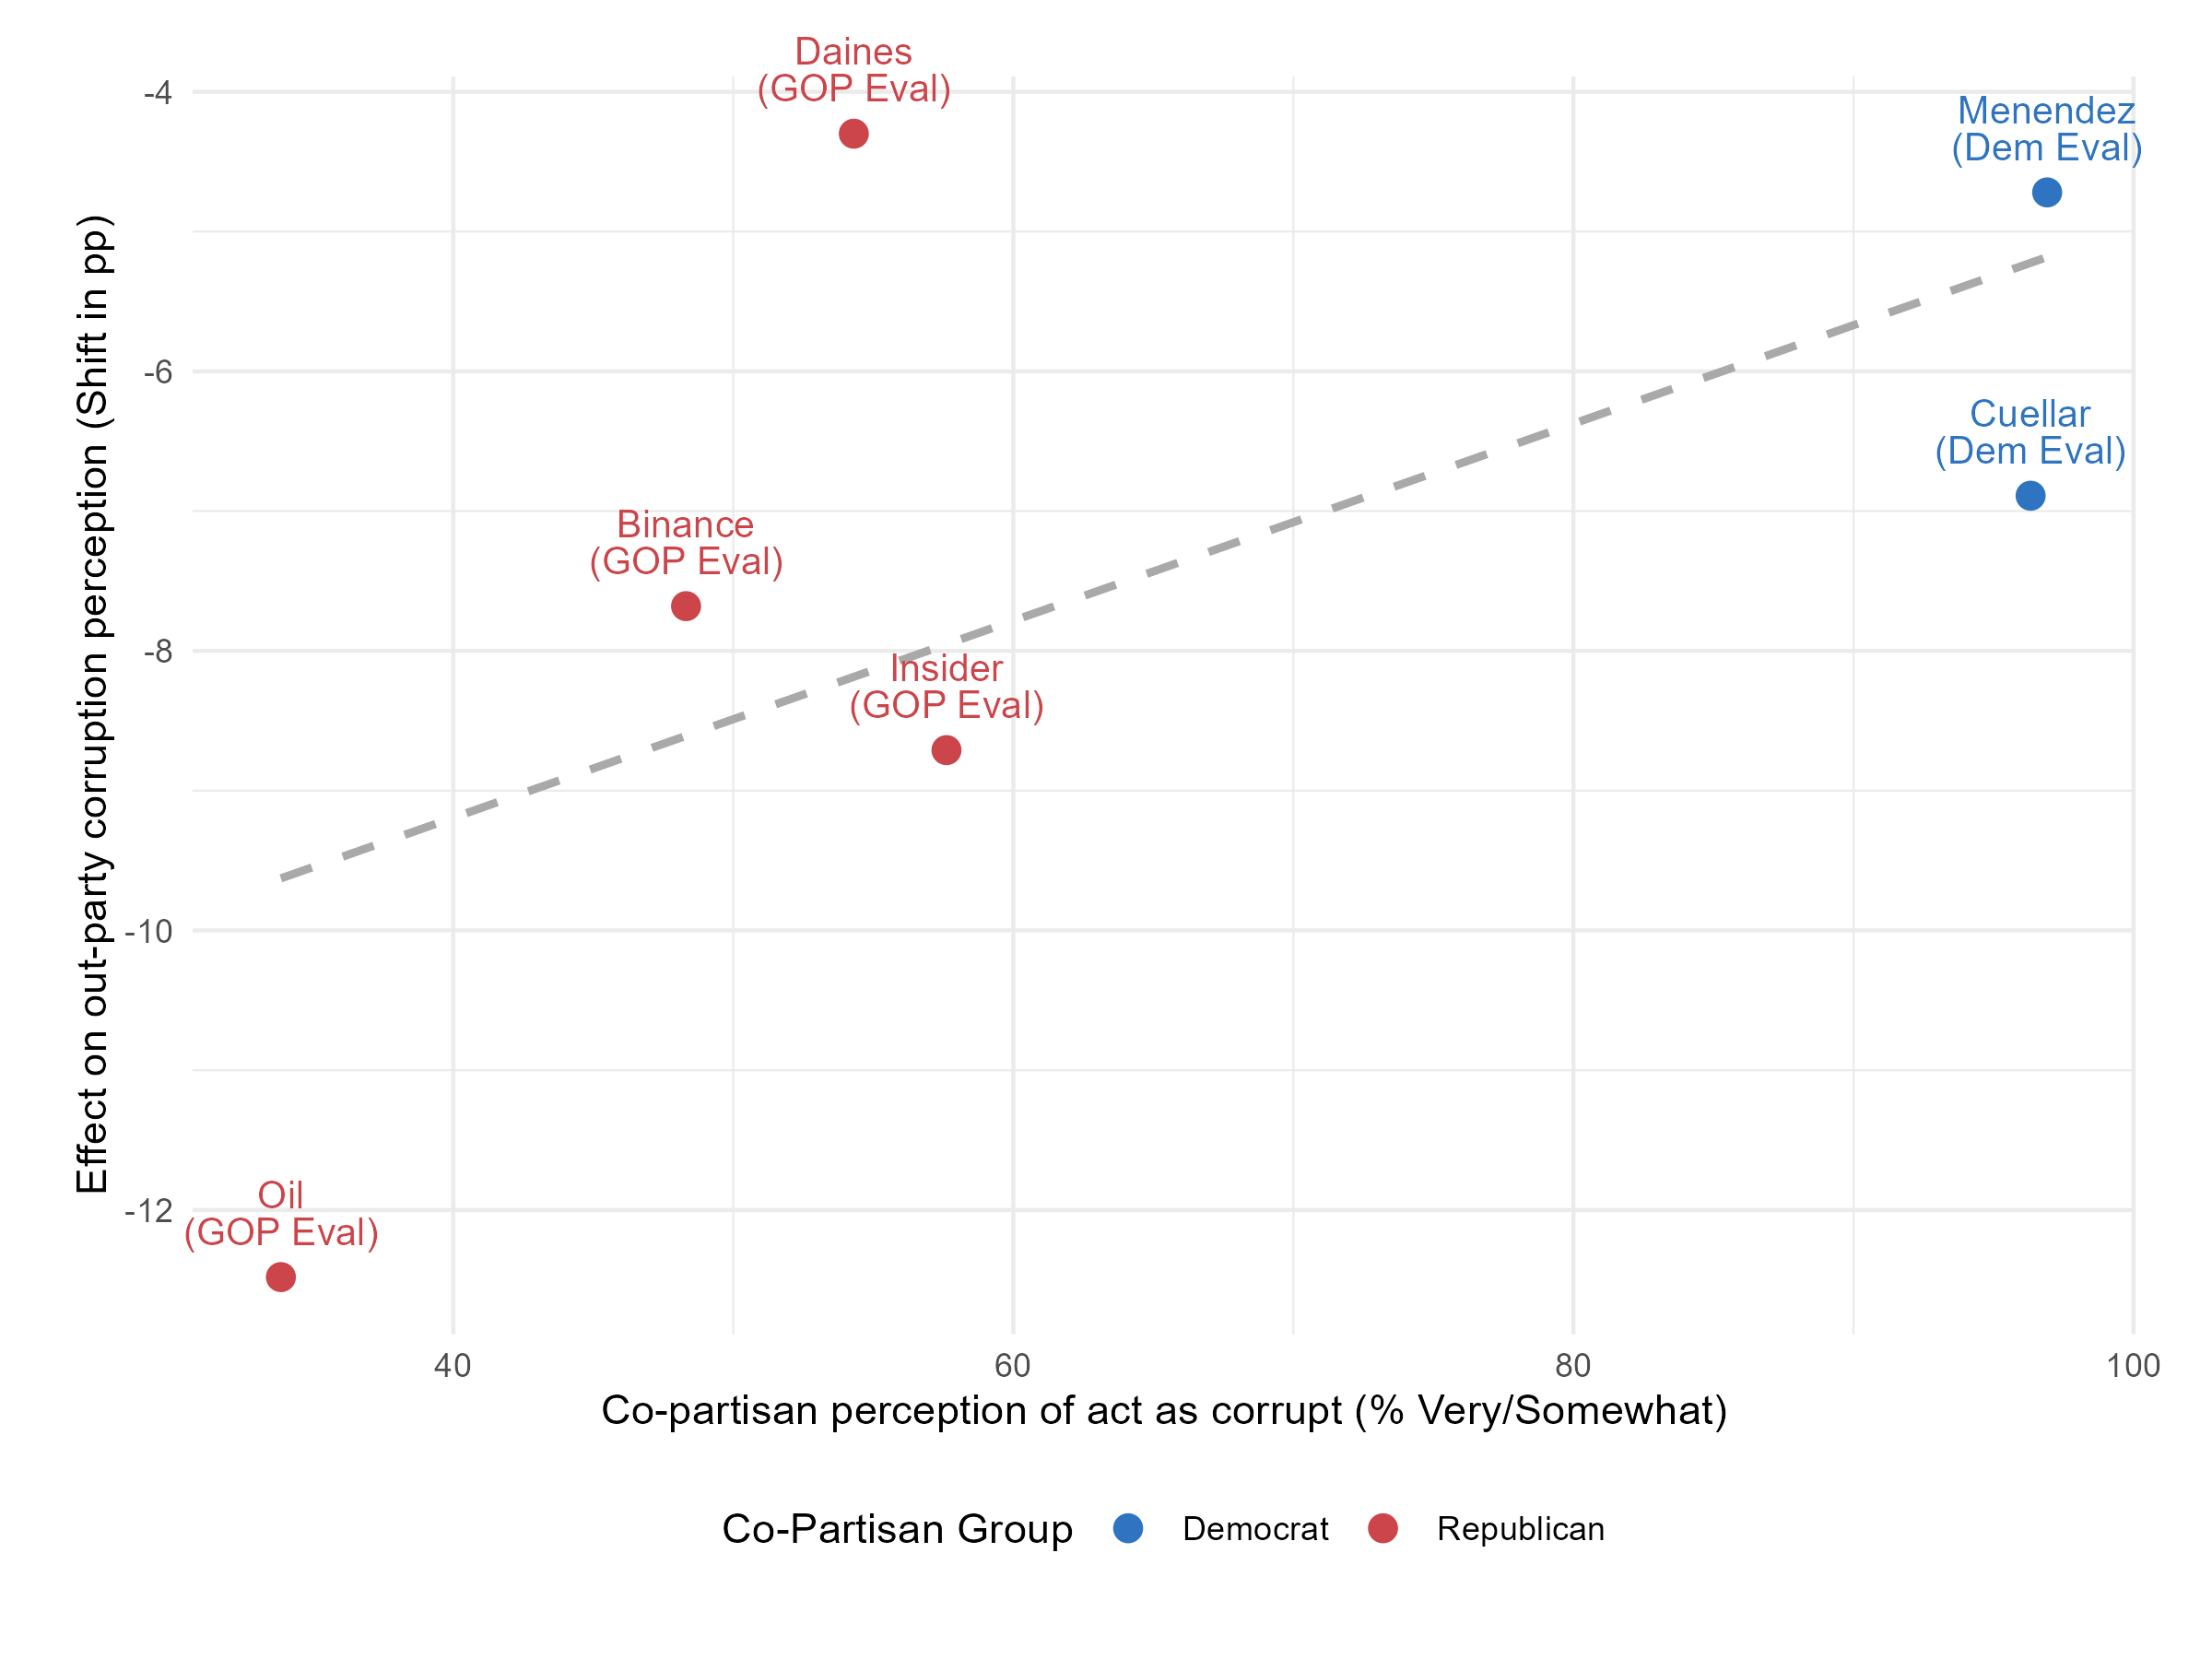
The scatterplot above maps how frequently co-partisans rated an act as "Very" or "Somewhat" corrupt (the X-axis) against that story's marginal effect on shifting out-party corruption perceptions (the Y-axis). We selected the effect on assessment of out-party corruption as an outcome, because in some cases the effect is to increase the perception that one’s own party is more corrupt, and in other cases it is to move towards “both parties are equally corrupt.” If simple assessments of how corrupt a story is were good predictors of effects on attitudes, then we would expect a slope from the upper left to the lower right, with more negative effects on the perception of out-party corruption.
But in fact we found the opposite, suggesting that it is not sufficient to ask voters about the level of corruption in a story of behavior of their co-partisans in power. We actually saw greater movement, on average, from stories that were viewed by co-partisans (of the politician described) as less corrupt. Part of this relationship is driven by smaller effects among Democrats who were more likely to rate the actions in the stories about Democrats as highly corrupt, but in either case, the relationship is noisy. So it seems that we need experiments to tell us about the causal effects of each vignette.
Crosstabs
| Topline | Party ID | Race | Gender | Education | Age Group | Region | 2024 Vote | |||||||||||||||||||
|---|---|---|---|---|---|---|---|---|---|---|---|---|---|---|---|---|---|---|---|---|---|---|---|---|---|---|
| Overall | Democrat | Republican | Independent | Other Party | White | Black | Hispanic | AAPI/Other | Man | Woman | Some other way | College | Non-college | 18-29 | 30-44 | 45-64 | 65+ | Northeast | Midwest | South | West | Harris | Trump | Other | Didn't Vote | |
| Do you think things in The United States are generally going in the right direction or the wrong direction? | ||||||||||||||||||||||||||
| Right direction | 33 | 6 | 72 | 22 | 12 | 38 | 21 | 22 | 25 | 37 | 29 | 22 | 34 | 32 | 12 | 30 | 38 | 38 | 32 | 34 | 34 | 29 | 4 | 71 | 8 | 13 |
| Wrong direction | 62 | 91 | 22 | 71 | 80 | 57 | 74 | 70 | 67 | 58 | 65 | 73 | 62 | 61 | 81 | 65 | 55 | 58 | 60 | 60 | 60 | 67 | 93 | 22 | 80 | 76 |
| IDK/Refused | 6 | 3 | 7 | 7 | 8 | 5 | 6 | 8 | 8 | 5 | 6 | 5 | 4 | 7 | 7 | 4 | 8 | 4 | 8 | 6 | 6 | 4 | 2 | 8 | 12 | 11 |
| Do you approve or disapprove of the way Donald Trump is handling his job as president? | ||||||||||||||||||||||||||
| Strongly approve | 25 | 3 | 58 | 15 | 10 | 30 | 12 | 16 | 20 | 26 | 24 | 27 | 24 | 26 | 6 | 19 | 30 | 33 | 24 | 26 | 26 | 24 | 2 | 56 | 5 | 10 |
| Somewhat approve | 12 | 1 | 25 | 11 | 8 | 14 | 5 | 11 | 15 | 14 | 11 | 1 | 13 | 12 | 9 | 12 | 14 | 11 | 12 | 13 | 13 | 10 | 1 | 26 | 9 | 9 |
| Somewhat disapprove | 8 | 7 | 5 | 12 | 10 | 6 | 9 | 17 | 10 | 9 | 7 | NA | 6 | 10 | 9 | 12 | 8 | 5 | 12 | 6 | 8 | 7 | 6 | 7 | 16 | 17 |
| Strongly disapprove | 52 | 88 | 9 | 60 | 67 | 49 | 71 | 55 | 51 | 49 | 55 | 67 | 56 | 50 | 72 | 55 | 46 | 50 | 50 | 53 | 50 | 56 | 91 | 9 | 58 | 56 |
| IDK/Refused | 2 | 2 | 2 | 2 | 5 | 2 | 4 | 2 | 4 | 2 | 3 | 5 | 1 | 3 | 4 | 2 | 3 | 2 | 1 | 2 | 3 | 3 | 1 | 2 | 13 | 8 |
| Total approve | 37 | 4 | 83 | 26 | 19 | 43 | 17 | 27 | 35 | 40 | 35 | 28 | 37 | 38 | 15 | 31 | 44 | 44 | 36 | 40 | 39 | 34 | 3 | 82 | 13 | 18 |
| Total disapprove | 60 | 95 | 14 | 72 | 77 | 55 | 79 | 71 | 61 | 58 | 62 | 67 | 62 | 59 | 81 | 67 | 53 | 54 | 63 | 59 | 58 | 63 | 97 | 16 | 74 | 74 |
| If the 2026 election for US Congress were held today, would you support the Democratic candidate or the Republican candidate on the ballot? | ||||||||||||||||||||||||||
| Democratic Candidate | 47 | 94 | 5 | 51 | 38 | 43 | 69 | 50 | 40 | 43 | 50 | 57 | 52 | 44 | 54 | 52 | 43 | 44 | 51 | 46 | 46 | 48 | 90 | 6 | 38 | 30 |
| Republican Candidate | 37 | 2 | 87 | 22 | 20 | 43 | 17 | 30 | 32 | 41 | 34 | 23 | 37 | 38 | 17 | 33 | 42 | 43 | 32 | 39 | 39 | 37 | 2 | 82 | 10 | 24 |
| IDK/Refused | 16 | 4 | 8 | 27 | 42 | 14 | 15 | 20 | 29 | 16 | 15 | 20 | 11 | 18 | 29 | 14 | 14 | 13 | 17 | 15 | 15 | 16 | 8 | 13 | 52 | 46 |
| [Cuellar] Do you see these events as … | ||||||||||||||||||||||||||
| Very corrupt | 82 | 85 | 80 | 82 | 82 | 83 | 89 | 73 | 79 | 83 | 81 | 85 | 83 | 81 | 81 | 77 | 84 | 84 | 78 | 87 | 81 | 81 | 85 | 82 | 69 | 78 |
| Somewhat corrupt | 13 | 12 | 12 | 15 | 15 | 13 | 7 | 17 | 13 | 12 | 14 | 5 | 13 | 13 | 15 | 14 | 10 | 14 | 16 | 8 | 12 | 16 | 12 | 12 | 24 | 17 |
| Not very corrupt | 4 | 4 | 6 | 2 | 1 | 4 | 3 | 7 | 3 | 4 | 4 | 10 | 2 | 5 | 1 | 8 | 4 | 2 | 5 | 4 | 4 | 2 | 3 | 5 | 7 | 3 |
| Not at all corrupt | 1 | 0 | 2 | 1 | 2 | 1 | 1 | 2 | 6 | 1 | 1 | NA | 2 | 1 | 3 | 1 | 2 | 0 | 0 | 1 | 2 | NA | 0 | 2 | 1 | 2 |
| [Menendez] Do you see these events as … | ||||||||||||||||||||||||||
| Very corrupt | 87 | 89 | 89 | 84 | 83 | 90 | 79 | 82 | 86 | 88 | 87 | 62 | 89 | 86 | 86 | 82 | 86 | 94 | 86 | 92 | 84 | 88 | 90 | 85 | 92 | 82 |
| Somewhat corrupt | 10 | 8 | 7 | 13 | 15 | 8 | 18 | 10 | 8 | 8 | 11 | 32 | 10 | 10 | 10 | 14 | 10 | 6 | 11 | 6 | 13 | 8 | 8 | 10 | 8 | 16 |
| Not very corrupt | 2 | 2 | 3 | 2 | 1 | 1 | 2 | 7 | 1 | 3 | 1 | 6 | 1 | 3 | 1 | 4 | 3 | 0 | 2 | 2 | 2 | 4 | 2 | 4 | NA | NA |
| Not at all corrupt | 1 | 1 | 0 | 1 | 1 | 1 | 2 | NA | 5 | 1 | 1 | NA | 1 | 1 | 3 | NA | 1 | 0 | 1 | 0 | 1 | NA | 0 | 1 | NA | 2 |
| [Binance Pardon] Do you see these events as … | ||||||||||||||||||||||||||
| Very corrupt | 58 | 88 | 20 | 68 | 75 | 53 | 77 | 69 | 61 | 54 | 62 | 73 | 62 | 56 | 71 | 59 | 57 | 54 | 57 | 58 | 54 | 66 | 94 | 18 | 68 | 63 |
| Somewhat corrupt | 19 | 8 | 28 | 17 | 21 | 22 | 8 | 14 | 14 | 22 | 17 | NA | 18 | 19 | 23 | 22 | 18 | 15 | 17 | 23 | 18 | 18 | 5 | 32 | 19 | 26 |
| Not very corrupt | 12 | 2 | 27 | 9 | 1 | 15 | 3 | 7 | 12 | 12 | 12 | 9 | 11 | 13 | 4 | 10 | 12 | 17 | 10 | 13 | 16 | 6 | 2 | 28 | 4 | 2 |
| Not at all corrupt | 10 | 1 | 25 | 6 | 3 | 11 | 11 | 10 | 14 | 12 | 9 | 18 | 10 | 11 | 2 | 8 | 12 | 14 | 16 | 6 | 11 | 10 | 0 | 22 | 8 | 8 |
| [Oil Industry Campaign Donations] Do you see these events as … | ||||||||||||||||||||||||||
| Very corrupt | 54 | 86 | 13 | 62 | 63 | 51 | 73 | 51 | 51 | 50 | 57 | 85 | 56 | 52 | 61 | 57 | 47 | 56 | 52 | 60 | 47 | 59 | 90 | 11 | 73 | 61 |
| Somewhat corrupt | 16 | 12 | 21 | 15 | 14 | 14 | 12 | 28 | 14 | 17 | 15 | NA | 16 | 16 | 23 | 19 | 15 | 12 | 14 | 13 | 18 | 17 | 9 | 24 | 17 | 14 |
| Not very corrupt | 15 | 1 | 29 | 17 | 6 | 19 | 4 | 5 | 20 | 16 | 14 | 12 | 14 | 16 | 8 | 12 | 16 | 19 | 17 | 14 | 19 | 8 | 1 | 32 | 4 | 12 |
| Not at all corrupt | 15 | 1 | 38 | 6 | 17 | 16 | 11 | 16 | 14 | 17 | 14 | 3 | 14 | 16 | 9 | 12 | 22 | 13 | 17 | 13 | 16 | 16 | 0 | 33 | 6 | 12 |
| [Insider Trading] Do you see these events as … | ||||||||||||||||||||||||||
| Very corrupt | 63 | 87 | 36 | 68 | 68 | 60 | 80 | 68 | 54 | 57 | 68 | 76 | 63 | 63 | 68 | 69 | 56 | 65 | 65 | 59 | 62 | 68 | 88 | 32 | 71 | 68 |
| Somewhat corrupt | 19 | 11 | 22 | 23 | 18 | 20 | 10 | 16 | 34 | 22 | 16 | NA | 18 | 19 | 20 | 22 | 20 | 14 | 18 | 19 | 18 | 21 | 11 | 28 | 11 | 19 |
| Not very corrupt | 10 | 2 | 21 | 6 | 5 | 12 | 3 | 4 | 6 | 9 | 10 | 24 | 10 | 10 | 6 | 6 | 11 | 13 | 9 | 11 | 11 | 6 | 1 | 20 | 3 | 12 |
| Not at all corrupt | 9 | 0 | 21 | 3 | 10 | 8 | 7 | 10 | 6 | 12 | 6 | NA | 9 | 8 | 6 | 3 | 14 | 8 | 8 | 11 | 10 | 5 | NA | 20 | 16 | 0 |
| [Daines] Do you see these events as … | ||||||||||||||||||||||||||
| Very corrupt | 44 | 60 | 24 | 46 | 51 | 42 | 53 | 43 | 41 | 43 | 45 | 30 | 43 | 44 | 43 | 43 | 46 | 42 | 41 | 43 | 48 | 38 | 60 | 24 | 60 | 41 |
| Somewhat corrupt | 35 | 36 | 31 | 40 | 34 | 34 | 35 | 42 | 30 | 37 | 33 | 38 | 39 | 32 | 47 | 42 | 30 | 28 | 32 | 38 | 31 | 42 | 36 | 33 | 35 | 38 |
| Not very corrupt | 12 | 3 | 21 | 10 | 11 | 13 | 8 | 8 | 15 | 12 | 11 | 18 | 10 | 13 | 10 | 9 | 11 | 15 | 15 | 11 | 13 | 6 | 4 | 20 | NA | 14 |
| Not at all corrupt | 10 | 1 | 25 | 5 | 4 | 11 | 4 | 8 | 14 | 8 | 11 | 14 | 9 | 11 | NA | 6 | 13 | 15 | 12 | 8 | 8 | 14 | 0 | 22 | 5 | 7 |
| Who do you think is more corrupt? | ||||||||||||||||||||||||||
| Democratic Party | 25 | 4 | 58 | 15 | 9 | 29 | 16 | 17 | 20 | 28 | 23 | 12 | 24 | 26 | 14 | 18 | 30 | 31 | 22 | 24 | 26 | 28 | 3 | 55 | 2 | 9 |
| Republican Party | 33 | 73 | 5 | 28 | 26 | 32 | 45 | 31 | 28 | 30 | 36 | 36 | 38 | 30 | 26 | 36 | 32 | 36 | 34 | 36 | 31 | 34 | 66 | 4 | 21 | 15 |
| Both are equally corrupt | 37 | 19 | 33 | 52 | 57 | 35 | 30 | 47 | 46 | 39 | 34 | 44 | 35 | 38 | 56 | 42 | 33 | 29 | 38 | 36 | 38 | 35 | 28 | 37 | 68 | 64 |
| Neither | 1 | 0 | 2 | 1 | 2 | 1 | 2 | 2 | 1 | 1 | 1 | 3 | 0 | 2 | 0 | 1 | 1 | 1 | 4 | 0 | 1 | 0 | 0 | 2 | 1 | 1 |
| IDK/Refused | 3 | 3 | 2 | 4 | 7 | 3 | 7 | 3 | 6 | 2 | 5 | 5 | 2 | 4 | 4 | 3 | 3 | 3 | 2 | 4 | 4 | 3 | 2 | 2 | 8 | 11 |
| Do you describe yourself as a man, a woman, or in some other way? | ||||||||||||||||||||||||||
| Man | 48 | 37 | 49 | 55 | 50 | 44 | 52 | 56 | 61 | 100 | NA | NA | 48 | 47 | 58 | 53 | 48 | 38 | 46 | 51 | 44 | 50 | 41 | 55 | 57 | 45 |
| Woman | 51 | 62 | 50 | 43 | 46 | 54 | 47 | 43 | 37 | NA | 100 | NA | 51 | 51 | 38 | 46 | 52 | 61 | 53 | 47 | 55 | 48 | 58 | 45 | 40 | 54 |
| Some other way | 1 | 1 | 1 | 2 | 4 | 1 | 1 | 2 | 3 | NA | NA | 100 | 1 | 2 | 4 | 1 | 1 | 1 | 1 | 2 | 1 | 1 | 2 | 1 | 4 | 1 |
| Which of the following best describes your race and ethnic background? | ||||||||||||||||||||||||||
| African-American or Black | 11 | 20 | 5 | 8 | 10 | NA | 100 | NA | NA | 12 | 10 | 11 | 9 | 12 | 6 | 12 | 14 | 8 | 11 | 8 | 16 | 6 | 16 | 5 | 3 | 14 |
| Asian-American, South-Asian, or Pacific Islander | 1 | 1 | 0 | 1 | 1 | NA | NA | NA | 30 | 1 | 1 | NA | 1 | 0 | 1 | 1 | 1 | 1 | 0 | 0 | 1 | 1 | 1 | 1 | NA | 2 |
| Hispanic or Latino | 17 | 20 | 12 | 17 | 18 | NA | NA | 100 | NA | 20 | 14 | 18 | 12 | 20 | 34 | 20 | 18 | 6 | 14 | 7 | 16 | 28 | 18 | 13 | 16 | 27 |
| Native American | 0 | 0 | 0 | 1 | 0 | NA | NA | NA | 14 | 1 | 0 | NA | 0 | 0 | 1 | 0 | 1 | 0 | 0 | 0 | 0 | 0 | 0 | 0 | 0 | 1 |
| White or Caucasian | 70 | 57 | 81 | 70 | 69 | 100 | NA | NA | NA | 65 | 74 | 65 | 76 | 66 | 56 | 66 | 65 | 84 | 72 | 83 | 66 | 62 | 64 | 80 | 78 | 53 |
| More than one of the above | 1 | 1 | 1 | 2 | 1 | NA | NA | NA | 42 | 1 | 1 | 2 | 1 | 1 | 2 | 1 | 1 | 1 | 1 | 1 | 1 | 1 | 1 | 1 | 1 | 2 |
| Other | 0 | 0 | 0 | 1 | 1 | NA | NA | NA | 14 | 0 | 0 | 3 | 0 | 0 | NA | 0 | 0 | 0 | 0 | 0 | 1 | 0 | 0 | 0 | 2 | 1 |
| What is the last year of education or degree you've finished? | ||||||||||||||||||||||||||
| 1st through 11th grade | 1 | 1 | 1 | 1 | 3 | 1 | 1 | 2 | 2 | 1 | 2 | 5 | NA | 2 | 4 | 1 | 0 | 1 | 1 | 1 | 0 | 2 | 0 | 1 | 4 | 4 |
| High School degree or GED | 20 | 21 | 21 | 18 | 21 | 20 | 22 | 20 | 18 | 18 | 21 | 13 | NA | 33 | 26 | 21 | 19 | 18 | 20 | 24 | 21 | 15 | 17 | 19 | 9 | 37 |
| Technical or vocational school | 6 | 4 | 6 | 8 | 6 | 6 | 3 | 7 | 7 | 7 | 6 | 4 | NA | 10 | 5 | 7 | 6 | 6 | 11 | 9 | 5 | 2 | 6 | 6 | 14 | 6 |
| Some college but no degree | 22 | 23 | 21 | 22 | 26 | 20 | 32 | 26 | 16 | 25 | 19 | 29 | NA | 37 | 27 | 18 | 25 | 22 | 21 | 23 | 22 | 24 | 22 | 23 | 13 | 23 |
| Associate's (2 year) degree | 11 | 12 | 11 | 9 | 12 | 10 | 11 | 15 | 15 | 8 | 13 | 18 | NA | 18 | 12 | 9 | 11 | 12 | 9 | 9 | 12 | 13 | 11 | 11 | 9 | 10 |
| Bachelor's (4 year) degree | 24 | 22 | 28 | 25 | 14 | 26 | 21 | 18 | 22 | 27 | 22 | 12 | 61 | NA | 22 | 28 | 23 | 22 | 22 | 19 | 24 | 30 | 24 | 27 | 31 | 12 |
| Graduate or professional degree | 16 | 18 | 12 | 16 | 17 | 17 | 10 | 10 | 20 | 13 | 18 | 19 | 39 | NA | 5 | 16 | 16 | 18 | 16 | 16 | 16 | 13 | 20 | 12 | 20 | 9 |
| In the 2024 election for US President, for whom did you vote? | ||||||||||||||||||||||||||
| Kamala Harris | 45 | 92 | 4 | 47 | 35 | 41 | 67 | 47 | 35 | 38 | 50 | 60 | 50 | 41 | 49 | 46 | 42 | 45 | 45 | 46 | 43 | 47 | 100 | NA | NA | NA |
| Donald Trump | 41 | 2 | 91 | 31 | 22 | 47 | 19 | 33 | 37 | 48 | 36 | 22 | 40 | 42 | 24 | 38 | 46 | 47 | 38 | 43 | 44 | 38 | NA | 100 | NA | NA |
| Chase Oliver | 1 | 0 | 0 | 3 | 1 | 1 | NA | 3 | 1 | 1 | 1 | 3 | 2 | 1 | 0 | 1 | 1 | 1 | 1 | 0 | 1 | 2 | NA | NA | 33 | NA |
| Jill Stein | 2 | 1 | NA | 4 | 8 | 3 | 1 | 0 | 3 | 3 | 2 | 7 | 3 | 2 | 2 | 3 | 2 | 2 | 2 | 3 | 2 | 2 | NA | NA | 67 | NA |
| Did not vote for President | 9 | 4 | 4 | 14 | 29 | 7 | 13 | 14 | 22 | 9 | 10 | NA | 5 | 12 | 19 | 12 | 8 | 5 | 13 | 6 | 10 | 8 | NA | NA | NA | 88 |
| Was not eligible to vote for President | 1 | 1 | 0 | 1 | 5 | 1 | 0 | 2 | 2 | 1 | 1 | 9 | 0 | 2 | 6 | 0 | 1 | 0 | 0 | 1 | 1 | 2 | NA | NA | NA | 12 |
| And today, when it comes to politics, do you think of yourself as more of a... | ||||||||||||||||||||||||||
| Democrat | 29 | 100 | NA | NA | NA | 24 | 55 | 35 | 26 | 23 | 35 | 26 | 30 | 29 | 34 | 27 | 30 | 28 | 35 | 26 | 28 | 30 | 60 | 1 | 8 | 15 |
| Independent | 28 | NA | NA | 100 | NA | 29 | 21 | 30 | 46 | 33 | 24 | 31 | 30 | 28 | 27 | 32 | 27 | 27 | 27 | 32 | 28 | 27 | 30 | 22 | 63 | 40 |
| Republican | 33 | NA | 100 | NA | NA | 38 | 16 | 25 | 16 | 34 | 32 | 17 | 33 | 32 | 17 | 29 | 34 | 40 | 28 | 30 | 37 | 31 | 3 | 72 | 3 | 14 |
| Something else | 7 | NA | NA | NA | 70 | 8 | 6 | 4 | 8 | 8 | 5 | 21 | 6 | 7 | 13 | 9 | 6 | 4 | 5 | 9 | 6 | 9 | 6 | 4 | 23 | 16 |
| Unsure | 3 | NA | NA | NA | 30 | 2 | 2 | 6 | 5 | 2 | 3 | 5 | 2 | 4 | 9 | 3 | 2 | 2 | 5 | 3 | 2 | 3 | 1 | 1 | 4 | 15 |
| Would you call yourself a strong Democrat or a not very strong Democrat? | ||||||||||||||||||||||||||
| Not very strong Democrat | 28 | 28 | NA | NA | NA | 27 | 26 | 30 | 54 | 29 | 27 | 25 | 26 | 29 | 39 | 33 | 30 | 15 | 30 | 29 | 26 | 28 | 24 | 100 | 19 | 67 |
| Strong Democrat | 72 | 72 | NA | NA | NA | 73 | 74 | 70 | 46 | 71 | 73 | 75 | 74 | 71 | 61 | 67 | 70 | 85 | 70 | 71 | 74 | 72 | 76 | NA | 81 | 33 |
| Would you call yourself a strong Republican or a not very strong Republican? | ||||||||||||||||||||||||||
| Not very strong Republican | 22 | NA | 22 | NA | NA | 22 | 16 | 27 | 20 | 21 | 23 | NA | 33 | 15 | 22 | 29 | 14 | 25 | 16 | 25 | 20 | 27 | 76 | 18 | 18 | 43 |
| Strong Republican | 78 | NA | 78 | NA | NA | 78 | 84 | 73 | 80 | 79 | 77 | 100 | 67 | 85 | 78 | 71 | 86 | 75 | 84 | 75 | 80 | 73 | 24 | 82 | 82 | 57 |
| Do you generally think of yourself as closer to... | ||||||||||||||||||||||||||
| The Democratic Party | 37 | NA | NA | 37 | NA | 38 | 44 | 31 | 20 | 34 | 39 | 62 | 45 | 31 | 39 | 37 | 34 | 38 | 36 | 39 | 36 | 37 | 63 | 3 | 28 | 27 |
| The Republican Party | 25 | NA | NA | 25 | NA | 28 | 4 | 21 | 24 | 30 | 19 | 18 | 25 | 24 | 15 | 23 | 30 | 24 | 21 | 29 | 22 | 27 | 2 | 68 | 9 | 13 |
| Neither | 36 | NA | NA | 36 | NA | 32 | 48 | 46 | 52 | 34 | 40 | 16 | 27 | 43 | 40 | 39 | 34 | 35 | 44 | 29 | 39 | 35 | 32 | 27 | 63 | 56 |
| Unsure | 2 | NA | NA | 2 | NA | 2 | 3 | 2 | 3 | 3 | 2 | 3 | 2 | 3 | 5 | 1 | 2 | 3 | NA | 3 | 3 | 2 | 3 | 2 | NA | 4 |
| How often do you pay attention to what's going on in government and politics? All the time, most of the time, about half the time, once in a while, or never | ||||||||||||||||||||||||||
| All the time | 42 | 48 | 40 | 35 | 48 | 42 | 38 | 42 | 32 | 43 | 41 | 39 | 47 | 38 | 28 | 37 | 44 | 48 | 36 | 41 | 42 | 45 | 50 | 39 | 37 | 18 |
| Most of the time | 34 | 32 | 37 | 37 | 23 | 35 | 36 | 29 | 44 | 36 | 34 | 24 | 38 | 32 | 32 | 42 | 30 | 34 | 38 | 36 | 32 | 35 | 33 | 38 | 27 | 27 |
| About half the time | 16 | 13 | 14 | 21 | 14 | 14 | 18 | 21 | 16 | 16 | 15 | 27 | 12 | 18 | 29 | 14 | 16 | 12 | 17 | 14 | 16 | 16 | 13 | 15 | 26 | 28 |
| Once in a while | 7 | 4 | 9 | 6 | 14 | 8 | 4 | 8 | 7 | 6 | 8 | 10 | 3 | 10 | 9 | 6 | 9 | 5 | 8 | 8 | 8 | 4 | 2 | 8 | 11 | 24 |
| Never | 1 | 2 | 1 | 1 | 1 | 1 | 4 | 0 | 1 | 0 | 2 | NA | 0 | 2 | 2 | 1 | 1 | 2 | 1 | 1 | 2 | NA | 2 | 0 | NA | 4 |
| In the past 12 months, how often did you discuss political, societal, or local issues with friends or family? | ||||||||||||||||||||||||||
| Basically every day | 33 | 34 | 30 | 30 | 45 | 35 | 30 | 26 | 26 | 32 | 33 | 42 | 39 | 29 | 25 | 31 | 34 | 36 | 28 | 37 | 30 | 36 | 38 | 31 | 33 | 17 |
| A few times a week | 37 | 41 | 37 | 39 | 22 | 37 | 36 | 37 | 46 | 42 | 33 | 24 | 38 | 36 | 37 | 42 | 37 | 33 | 37 | 34 | 39 | 37 | 40 | 37 | 31 | 27 |
| A few times a month | 15 | 13 | 16 | 18 | 11 | 14 | 17 | 19 | 14 | 12 | 17 | 24 | 14 | 15 | 26 | 15 | 11 | 16 | 15 | 17 | 14 | 14 | 14 | 15 | 15 | 20 |
| Once a month | 4 | 3 | 4 | 4 | 3 | 3 | 2 | 8 | 2 | 4 | 4 | 8 | 3 | 4 | 3 | 5 | 5 | 2 | 5 | 3 | 2 | 6 | 2 | 5 | 5 | 6 |
| Less than once a month | 5 | 2 | 6 | 5 | 10 | 5 | 6 | 4 | 9 | 5 | 6 | NA | 4 | 6 | 2 | 4 | 7 | 5 | 5 | 5 | 6 | 4 | 1 | 6 | 5 | 19 |
| Not at all | 6 | 6 | 7 | 5 | 9 | 6 | 9 | 6 | 4 | 5 | 8 | 1 | 2 | 9 | 7 | 4 | 6 | 8 | 10 | 5 | 7 | 4 | 5 | 6 | 10 | 11 |
| How important is politics to your personal identity? | ||||||||||||||||||||||||||
| Extremely important | 17 | 20 | 17 | 13 | 17 | 16 | 24 | 16 | 16 | 18 | 16 | 20 | 21 | 14 | 13 | 18 | 16 | 17 | 12 | 16 | 20 | 16 | 20 | 17 | 16 | 3 |
| Very important | 22 | 27 | 21 | 18 | 18 | 22 | 20 | 20 | 13 | 22 | 22 | 22 | 23 | 21 | 19 | 25 | 18 | 24 | 26 | 18 | 20 | 24 | 26 | 20 | 12 | 11 |
| Somewhat important | 29 | 31 | 27 | 32 | 17 | 28 | 27 | 30 | 38 | 29 | 28 | 19 | 27 | 30 | 30 | 28 | 27 | 31 | 26 | 31 | 27 | 30 | 31 | 29 | 18 | 20 |
| Not too important | 18 | 13 | 21 | 18 | 19 | 19 | 12 | 16 | 17 | 17 | 18 | 21 | 18 | 17 | 16 | 17 | 22 | 14 | 17 | 19 | 17 | 18 | 12 | 22 | 15 | 24 |
| Not at all important | 12 | 6 | 13 | 17 | 18 | 12 | 9 | 15 | 11 | 13 | 12 | 3 | 10 | 14 | 14 | 10 | 15 | 11 | 18 | 11 | 13 | 10 | 7 | 12 | 30 | 33 |
| IDK/Refused | 3 | 3 | 1 | 2 | 10 | 2 | 7 | 3 | 5 | 2 | 4 | 14 | 1 | 4 | 7 | 2 | 2 | 3 | 1 | 5 | 3 | 2 | 3 | 1 | 8 | 8 |
| Do you consider yourself to be a feminist? | ||||||||||||||||||||||||||
| Yes | 33 | 53 | 11 | 36 | 44 | 35 | 23 | 37 | 23 | 25 | 40 | 75 | 44 | 27 | 52 | 39 | 28 | 28 | 36 | 33 | 29 | 38 | 56 | 11 | 40 | 25 |
| No | 54 | 37 | 78 | 48 | 38 | 53 | 64 | 50 | 57 | 62 | 47 | 15 | 45 | 59 | 35 | 50 | 59 | 57 | 54 | 53 | 58 | 47 | 33 | 77 | 43 | 52 |
| IDK/Refused | 13 | 10 | 11 | 17 | 18 | 13 | 13 | 14 | 20 | 13 | 13 | 10 | 11 | 14 | 14 | 10 | 13 | 15 | 10 | 14 | 13 | 15 | 12 | 12 | 17 | 23 |
| Age from voter file. | ||||||||||||||||||||||||||
| 18-29 | 11 | 13 | 6 | 10 | 24 | 9 | 6 | 22 | 17 | 13 | 8 | 32 | 7 | 13 | 11 | NA | NA | NA | 10 | 11 | 9 | 14 | 12 | 6 | 7 | 26 |
| 30-44 | 27 | 25 | 24 | 31 | 32 | 26 | 30 | 32 | 26 | 30 | 24 | 22 | 30 | 25 | NA | 27 | NA | NA | 28 | 27 | 25 | 30 | 28 | 25 | 35 | 32 |
| 45-64 | 34 | 35 | 36 | 32 | 28 | 32 | 44 | 36 | 37 | 34 | 34 | 23 | 33 | 34 | NA | NA | 34 | NA | 42 | 33 | 36 | 25 | 32 | 37 | 29 | 29 |
| 65+ | 28 | 27 | 34 | 27 | 15 | 34 | 20 | 10 | 20 | 23 | 34 | 22 | 29 | 28 | NA | NA | NA | 28 | 20 | 30 | 30 | 30 | 28 | 32 | 28 | 14 |
| Region from voter file. | ||||||||||||||||||||||||||
| Northeast | 17 | 20 | 15 | 16 | 16 | 18 | 16 | 15 | 17 | 16 | 17 | 13 | 16 | 17 | 16 | 18 | 21 | 12 | 17 | NA | NA | NA | 17 | 15 | 17 | 22 |
| Midwest | 23 | 20 | 21 | 26 | 27 | 27 | 17 | 10 | 19 | 24 | 21 | 28 | 20 | 24 | 22 | 22 | 22 | 24 | NA | 23 | NA | NA | 23 | 24 | 24 | 17 |
| South | 38 | 36 | 43 | 37 | 28 | 35 | 54 | 37 | 36 | 35 | 40 | 36 | 39 | 37 | 31 | 35 | 40 | 40 | NA | NA | 38 | NA | 36 | 40 | 28 | 39 |
| West | 23 | 24 | 22 | 21 | 28 | 20 | 13 | 39 | 28 | 24 | 22 | 23 | 25 | 21 | 30 | 25 | 17 | 24 | NA | NA | NA | 23 | 24 | 21 | 31 | 23 |
Methodological Statement
Sampling
We sampled potential respondents from the L2 voter file of registered voters. The population was divided into 36 non-overlapping strata based on race, age, participation in the 2024 general election, party alignment, and educational attainment model category. This stratification schema was used to define a target number of completes for each stratum, sampled inversely proportional to expected response rates based on past surveys, oversampling to allow for variation from these expected response rates. After defining stratification and targets, we then limited the sample to records with cell-phones. We supplemented this text-to-web survey with a sample of Rep Data panelists who had been matched to the voter file, to mitigate concerns over coverage of a cell-only sample and other mode-specific non-response biases. We then reconstructed which sampling strata these Rep Data panelists belonged to based on voter file data.
Fielding
The text-to-web and live interviewer surveys were fielded from Thursday, April 9, 2026 through Sunday, April 12, 2026. The first day of fielding was a “soft launch” limiting the number of records. We then activated the DRASS sampling system to adjust for relative non-response across sampling strata. We also set quotas matching target numbers for the completed responses by strata, such that we did not initiate any new surveys to respondents from strata where the quotas had been met, but did not terminate respondents after their respective stratum-level quota had been met either.
We checked for duplicate records in the text sample and found none, resulting in a final total of 1044 completed interviews via text-to-web.
The panel-to-web surveys were from a list of registered voter targets from Rep Data, who matched their panelists to the L2 voter file, limiting the respondents to those who were affirmatively matched. These panelists were then interviewed from Wednesday, April 8, 2026 through Monday, April 13, 2026, with quotas in place matching the sample stratification targets. These responses were then matched back to the L2 file, appending the demographic necessary to reconstruct their sampling strata. We completed 495 interviews via panel-to-web fielding, for a combined mixed-mode sample of 1539 interviews.
Weighting
We first created base weights by rake weighting the text-to-web sample back to stratification benchmarks using fields associated with the respondents in the voter file. We then use these weights to estimate the frequency of survey taking, creating bins. Then we rake weight the panel-to-web responses using both the distribution of strata and this binned estimate of survey response frequency to create base weights for the panel-to-web survey. Finally, with these base weights as starting values, we pool the data together and rake the combined sample to the strata distribution, survey response frequency, census region, race, educational attainment, gender using self-reports, and party affiliation using self-reports. Weighting targets for census region, race, educational attainment, gender, and party affiliation are derived from the Pew NPORS survey conducted January 2025. Weights were trimmed at the 5th and 95th percentiles.
After accounting for the Kish 1+L approximation of the design effect from weighting, the margin of error is 1.62 percentage points.
Other Disclosures
This survey of registered voters in the United States was paid for by Survey 160 as part of our ongoing methodological research initiatives. All estimates of public opinion have sources of error beyond that which is captured by the margin of error, including non-ignorable (post weighting) non-response error, frame and coverage error, measurement error and processing error.
Survey Instrument
Right Direction / Wrong Direction
Q1: Right/Wrong Direction
First, do you think things in the United States are generally going in the right direction or the wrong direction?
- Right direction
- Wrong direction
- Don't know / No Opinion / Not Sure
- Refused
Attention Barometer
Q2: Attention Barometer
In a few words, what news story caught your attention this week? News can be anything you follow, whether local TV, websites, podcasts, or social media, on any topic like sports, entertainment, or politics. We just want to know what caught your attention. If you can't think of anything specific, that's okay, just say so. Please reply in your own words.
[Open end]
Presidential Job Approval & Favorability
Q3: Presidential Job Approval (Donald Trump)
Do you approve or disapprove of the way Donald Trump is handling his job as president?
- Strongly approve
- Somewhat approve
- Somewhat disapprove
- Strongly disapprove
- Don't know / No Opinion / Not Sure
- Refused
Q4: Generic Ballot
If the 2026 election for US Congress were held today, would you support the Democratic candidate or the Republican candidate on the ballot?
- The Democratic Candidate
- The Republican Candidate
- Don't know / No Opinion / Not Sure
- Refused
Experiment Module: Corruption Evaluations
Q5: Open-Ended Corruption
Now to a different topic, we are interested in how you view political corruption. In a few words, can you give an example of something you see as corrupt in government?
[Open end; half of respondents randomly limited to 160 characters]
Q6 Instructions: Next we are going to ask you about three recent events that some people have called corrupt. For each, we want you to tell us whether you see these events as very corrupt, somewhat corrupt, not very corrupt, or not at all corrupt. [3 of 6 vignettes randomly selected and ordered]
Q6a: Cuellar
- Very corrupt
- Somewhat corrupt
- Not very corrupt
- Not at all corrupt
Q6b: Menendez
- Very corrupt
- Somewhat corrupt
- Not very corrupt
- Not at all corrupt
Q6c: Binance Pardon
- Very corrupt
- Somewhat corrupt
- Not very corrupt
- Not at all corrupt
Q6d: Oil Industry Campaign Donations
- Very corrupt
- Somewhat corrupt
- Not very corrupt
- Not at all corrupt
Q6e: Insider Trading
- Very corrupt
- Somewhat corrupt
- Not very corrupt
- Not at all corrupt
Q6f: Daines
- Very corrupt
- Somewhat corrupt
- Not very corrupt
- Not at all corrupt
Q7: Party Corruption
Who do you think is more corrupt?
- The Democratic Party
- The Republican Party
- Both are equally corrupt
- Neither
- Don't know / No Opinion / Not Sure
- Refused
Demographics
Q8: Gender
Do you describe yourself as a man, a woman, or in some other way?
- Man
- Woman
- Some other way
Q9: Year of Birth
In what year were you born? Please respond with a four-digit year.
Q10: Race
Which of the following best describes your race and ethnic background?
- African-American or Black
- Asian-American, South-Asian, or Pacific Islander
- Hispanic or Latino
- Native American
- White or Caucasian
- More than one of the above
- Other (please specify)
Q11: Education Level
What is the last year of education or degree you've finished?
- 1st through 11th grade
- High School degree or GED
- Technical or vocational school
- Some college but no degree
- Associate's (2 year) degree
- Bachelor's (4 year) degree
- Graduate or professional degree
Partisanship
Q12: Vote Choice 2024
In the 2024 election for US President, for whom did you vote?
- Democrat Kamala Harris
- Republican Donald Trump
- Libertarian Chase Oliver
- Green Party candidate Jill Stein
- Some other candidate (please specify)
- Did not vote for President
- Was not eligible to vote for President
Q13: Party ID
And today, when it comes to politics, do you think of yourself as more of a …
- Democrat → Q14a
- Republican → Q14b
- Independent → Q14c
- Something else
- Unsure
Q14a: Strength – Democrat
Would you call yourself a strong Democrat or a not very strong Democrat?
- Strong Democrat
- Not very strong Democrat
Q14b: Strength – Republican
Would you call yourself a strong Republican or a not very strong Republican?
- Strong Republican
- Not very strong Republican
Q14c: Party ID Lean
Do you generally think of yourself as closer to …
- The Democratic Party
- The Republican Party
- Neither
- Unsure
Q15: Feminist
Do you consider yourself to be a feminist?
- Yes
- No
- Don't know / No Opinion / Not Sure
Political Interest / Attention
Q16: Political Attention
How often do you pay attention to what's going on in government and politics?
- All the time
- Most of the time
- About half the time
- Once in a while
- Never
Q17: Political Talk
In the past 12 months, how often did you discuss political, societal, or local issues with friends or family?
- Basically every day
- A few times a week
- A few times a month
- Once a month
- Less than once a month
- Not at all
Q18: Importance of Politics to Identity
How important is politics to your personal identity?
- Extremely important
- Very important
- Somewhat important
- Not too important
- Not at all important
- Don't know / No Opinion / Not Sure
Q19–21: Embargoed
Q22: Other Polls
Sometimes, people answer multiple polls from different survey organizations. Besides this poll, how many polls have you answered in the last month? Please reply with a specific number, and if you cannot recall exactly, please just give your best guess.
Q23: Income
Finally, last year, that is in 2025, what was your total family income from all sources, before taxes?
- Less than $30,000
- $30,000 to less than $40,000
- $40,000 to less than $50,000
- $50,000 to less than $70,000
- $70,000 to less than $100,000
- $100,000 to less than $125,000
- $125,000 to less than $150,000
- $150,000 or more