
Survey 160 Tracking Poll, March 2026
By Stephanie Pedron and Kevin Collins
Today we are releasing the results from our ongoing Survey 160 tracking poll conducted March 9 - 15, 2026. In addition to our continued research on presidential approval and the congressional generic ballot, this latest poll looks at two substantive questions. First, we continue our experimental research on perceptions of party corruption and what does (or does not) move those perceptions. Second, we look at whether presenting respondents with a Mercator projection map – which exaggerates the area of land masses closer to the Earth’s poles – causes respondents to similarly increase their perceptions of Greenland’s importance to U.S. National Security interests.
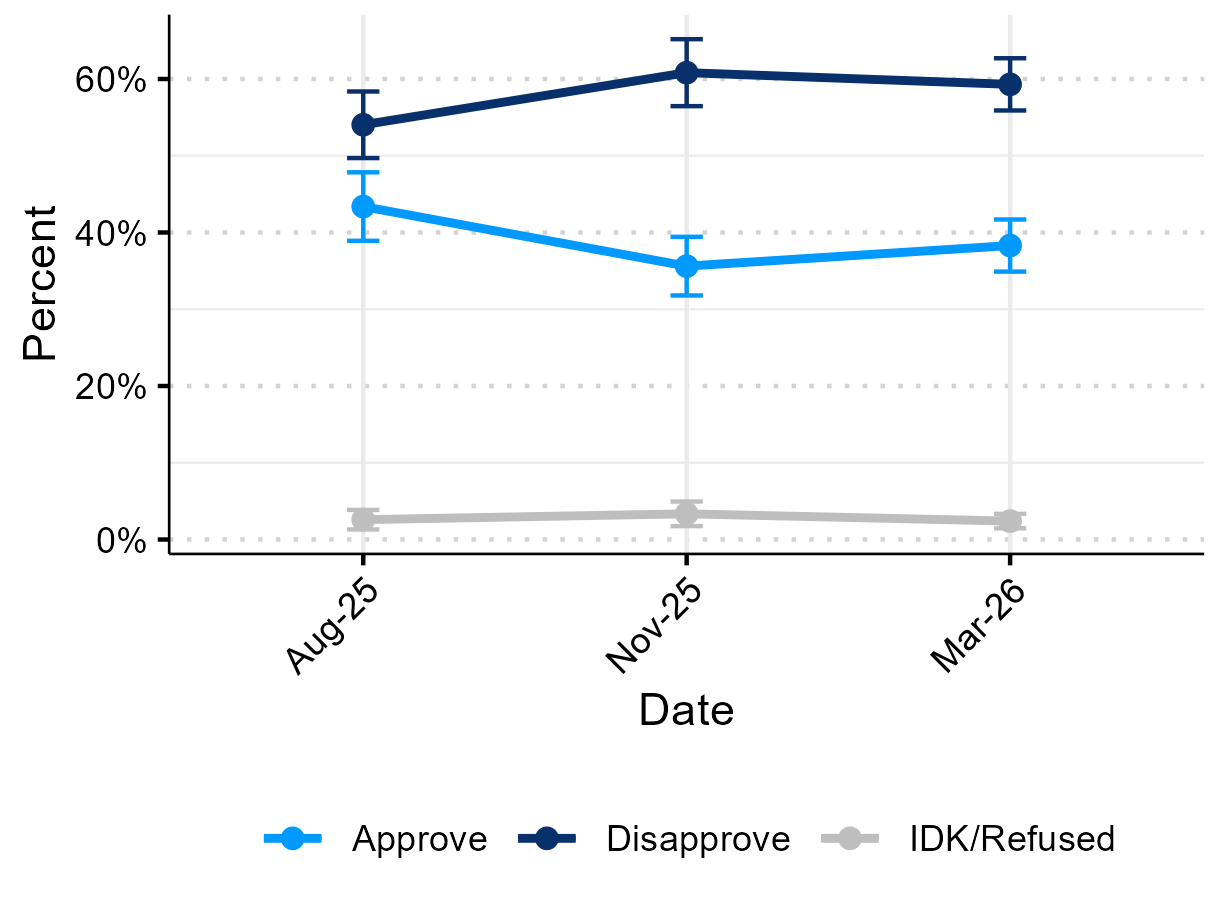
In a mixed mode text-to-web and online panel survey to registered voters nationwide, fielded in early March (see full methodological details at the bottom of this blog post), we find that Donald Trump’s approval has changed only slightly since our last poll fielded in late November. 38% of respondents somewhat or strongly approve of the way Trump is handling his job as president (slightly up from 36% last poll), while 59% of respondents either somewhat or strongly disapprove (slightly down from 61% last poll).
Presidential Approval over Three Survey Waves
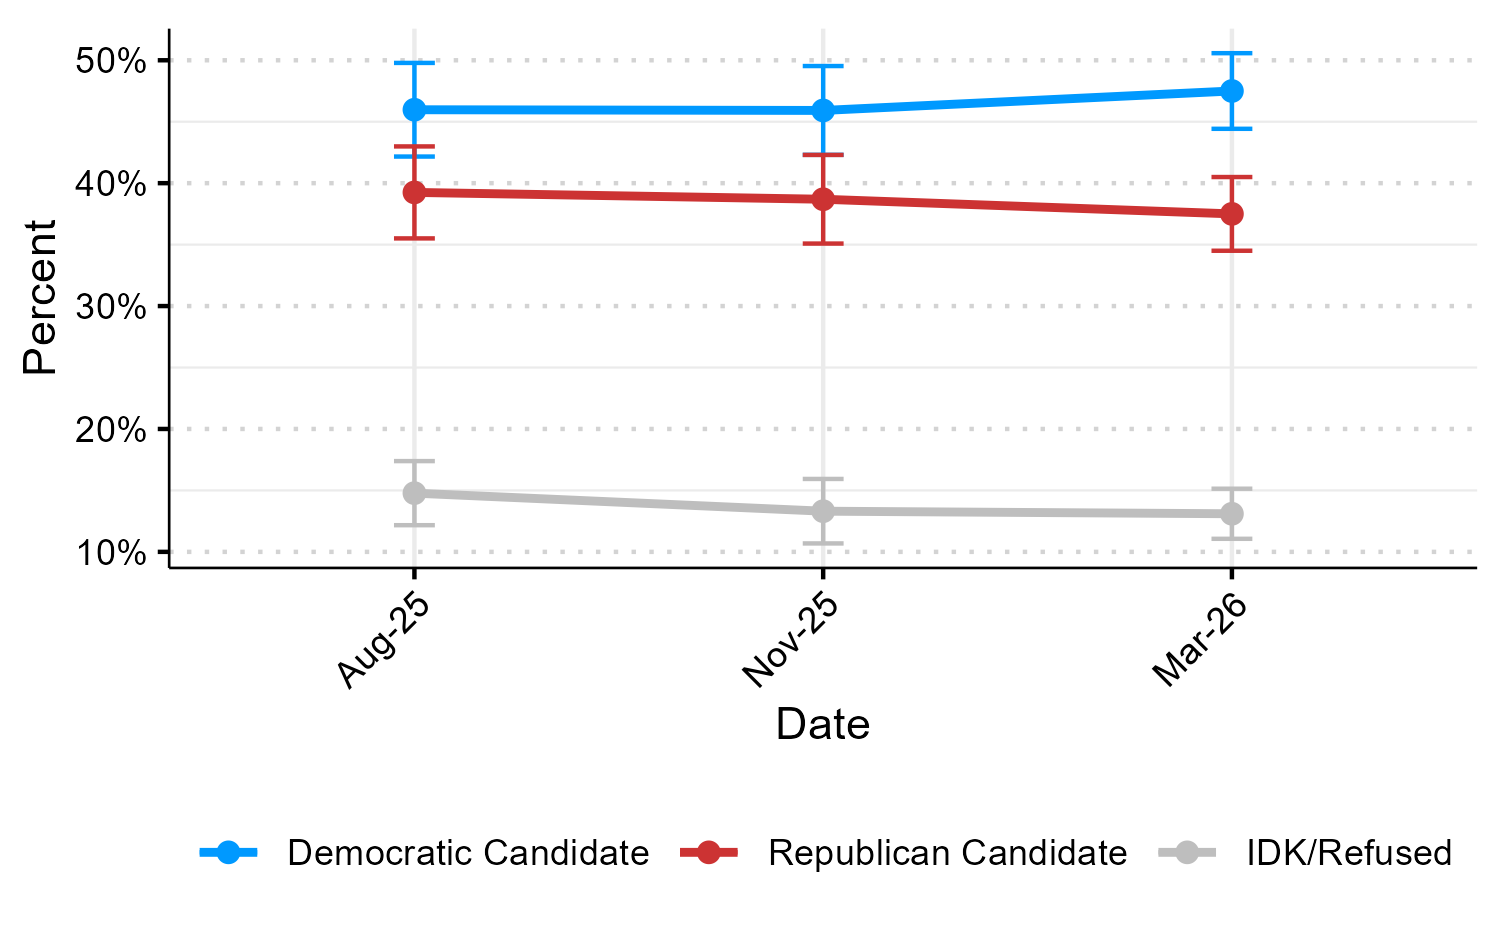
Our last Survey 160 tracking poll showed Democrats with a 7-point lead in the generic ballot for the US House – but that lead has expanded to 10 points in our latest poll. Unsurprisingly, this shift is driven by Independent voters. In November, 48% of Independents said they would support a Democratic candidate on the ballot, 27% said they would support a Republican, and 24% were unsure. By March, support among independents had climbed to 53% for Democratic candidates and dropped to 21% for Republican candidates, while 25% were undecided.
Full question wording and crosstabs are available below.
Generic Congressional Ballot Preference over Three Survey Waves
Turning to the topic of public corruption, in the November survey we ran a survey experiment to see how perceptions of relative levels of corruption of America’s two major political parties were shaped by policy information. Some respondents were first asked about their perceptions of the relative corruption of Democrats and Republicans (the control group), while others were first asked about a pardon by President Donald Trump of the chair of the crypto company Binance, who had invested in Trump family companies, and then immediately after that asked about their perceptions of corruption.
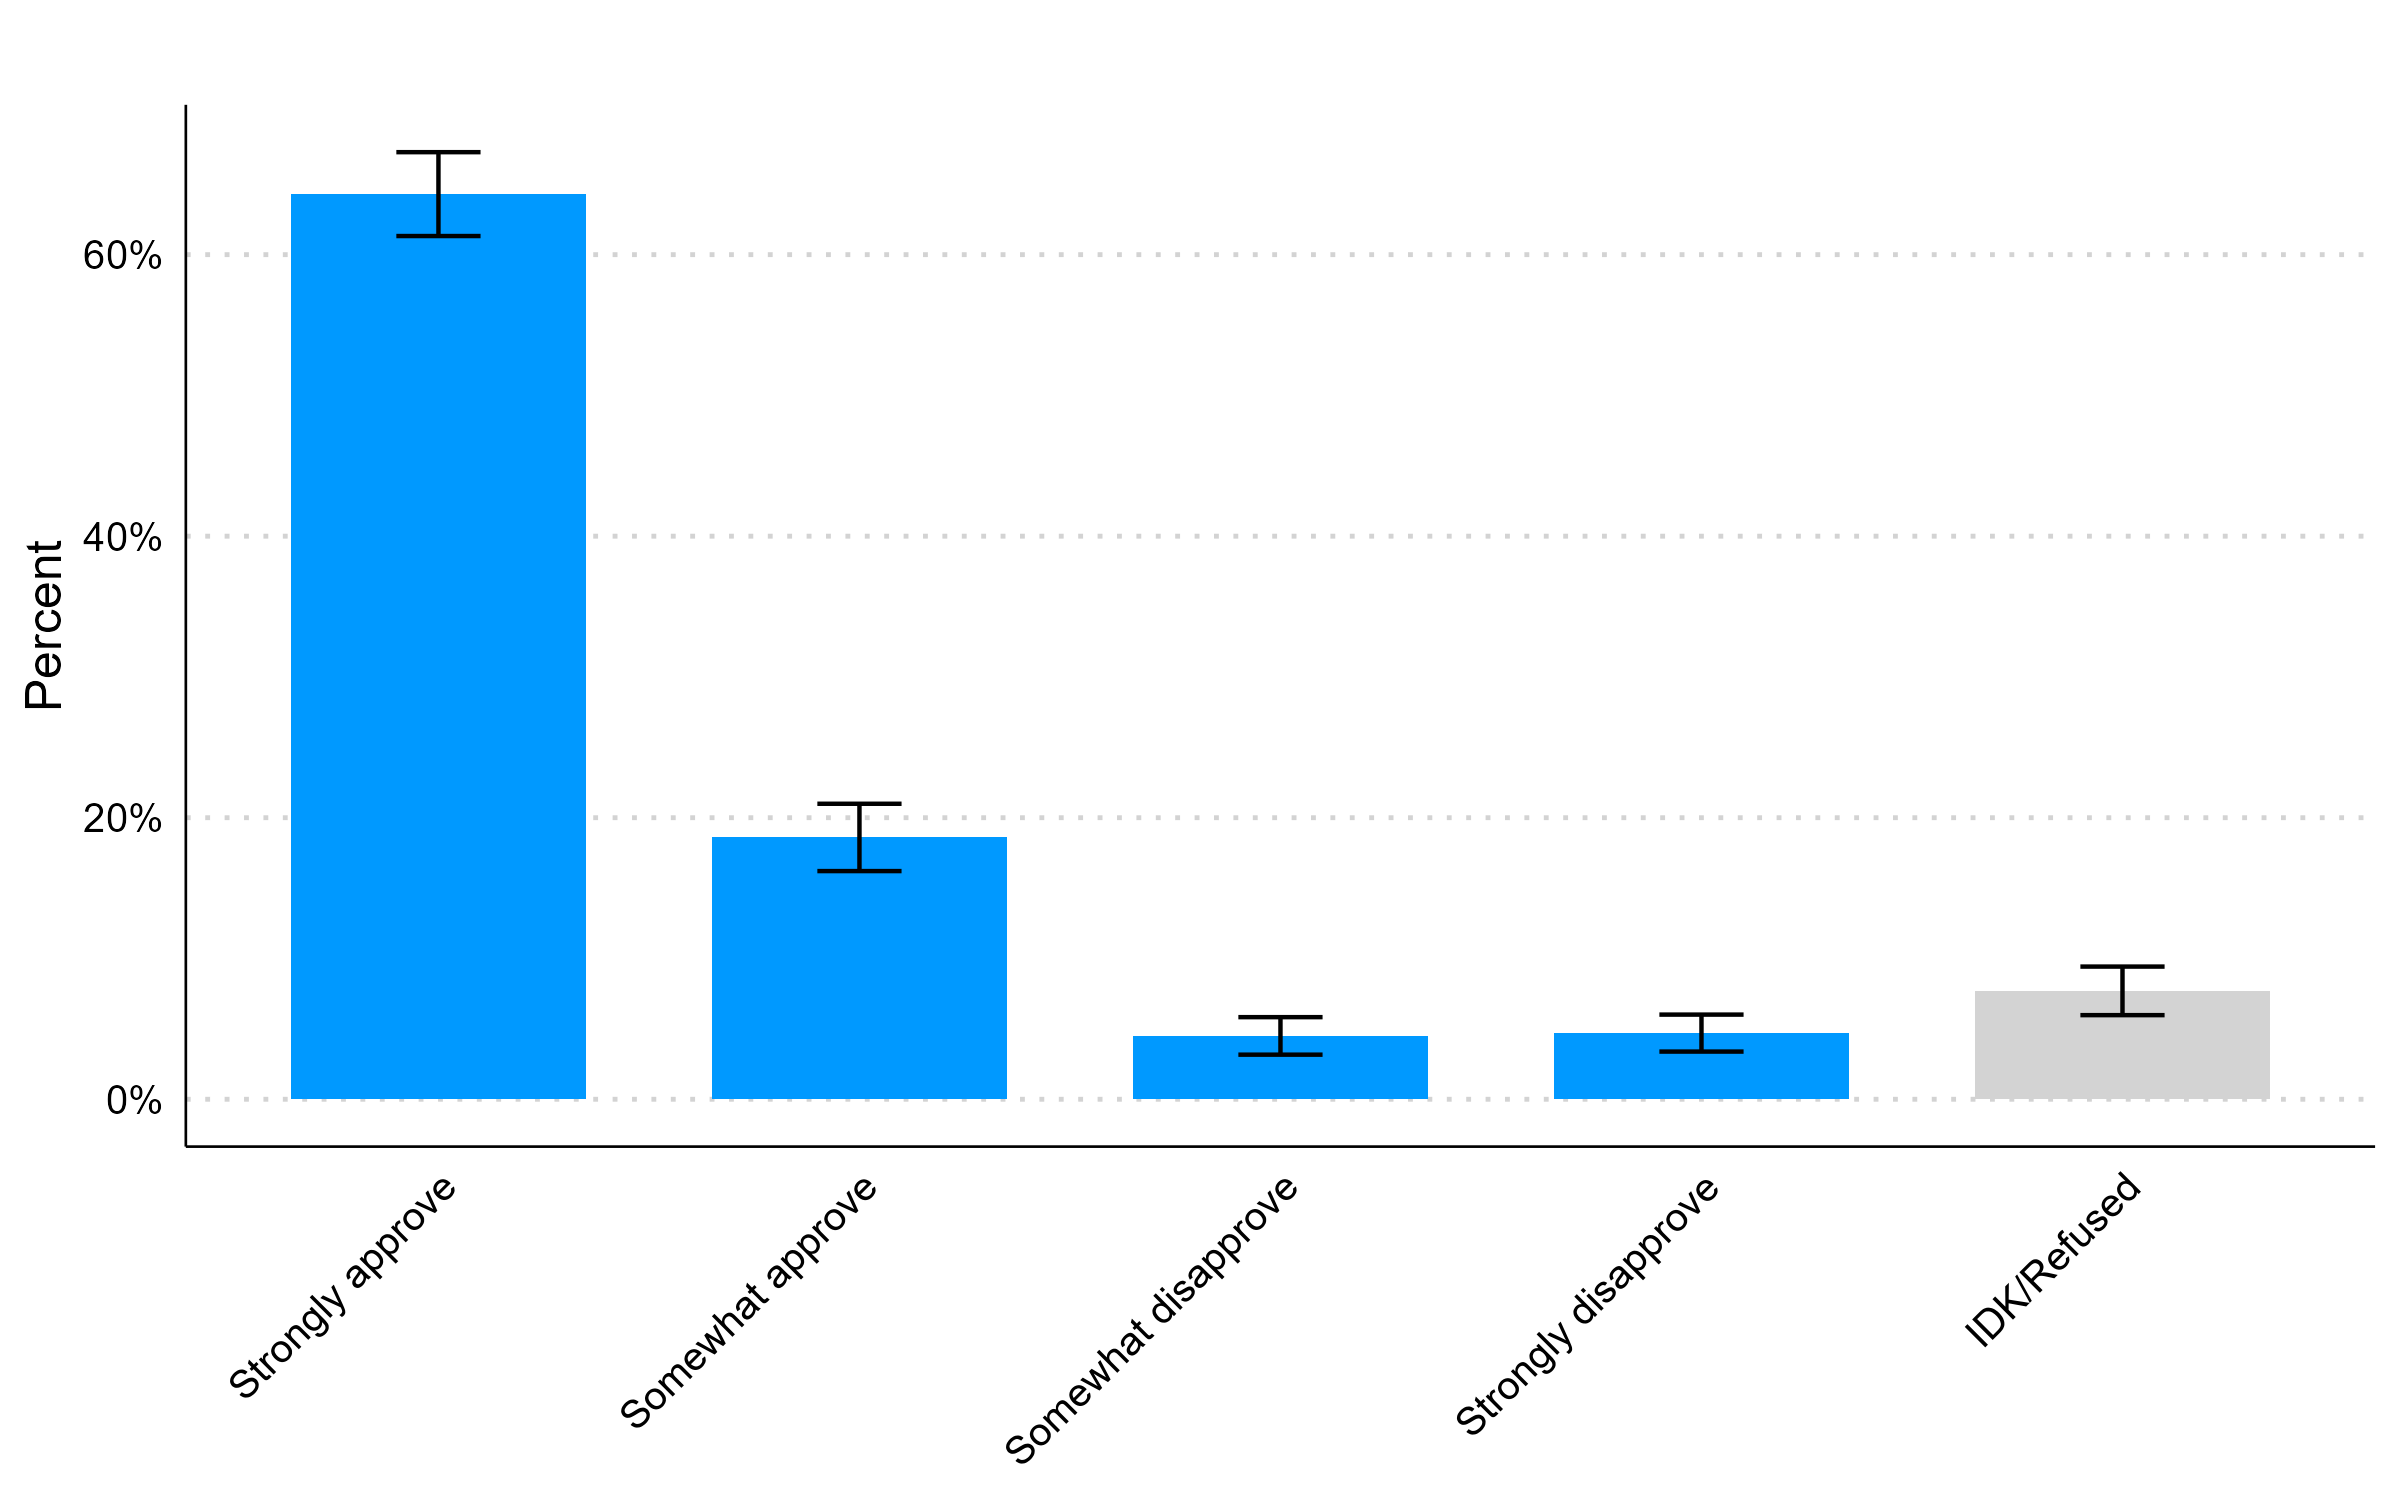
We ran a similar survey experiment this month, but instead of asking about an allegedly corrupt action by the administration, we asked about anti-corruption legislation promoted by Jon Ossoff and other Senate Democrats: the “Ban Congressional Stock Trading Act.”
The question read:
In 2025, Democratic Senator Jon Ossoff, introduced a bill called the "Ban Congressional Stock Trading Act." This bill would stop members of Congress and their families from buying and selling stocks. Members of Congress often see private information that can change how the stock market performs. They also help create laws that affect certain businesses. Some people believe this means Congress members could use their jobs to make money unfairly through stock trading. However, others argue that this bill would wrongly keep Congress members and their families from investing their own money however they choose.
Do you approve or disapprove of this proposed law?
The survey shows that the bill is highly popular. 83% of respondents strongly or somewhat approved of the bill, while only 9% strongly or somewhat disapproved of the bill. Across party lines, voters are broadly supportive of measures to prevent Congress members from using insider knowledge for personal financial gain.
Views towards the Ban Congressional Stock Trading Act
But did it move party perceptions?
Before this policy question (in the control group) or after (in the treatment group, respondents were asked the following skippable question:
Who do you think is more corrupt …
The Democratic Party
The Republican Party
Both are equally corrupt
Neither
We can compare the responses of people who were asked about corruption after receiving some information about the anti-corruption bill to those who were asked about corruption before receiving information about the bill. Here’s what we see:
Perceptions of Party Corruption by Experimental Condition
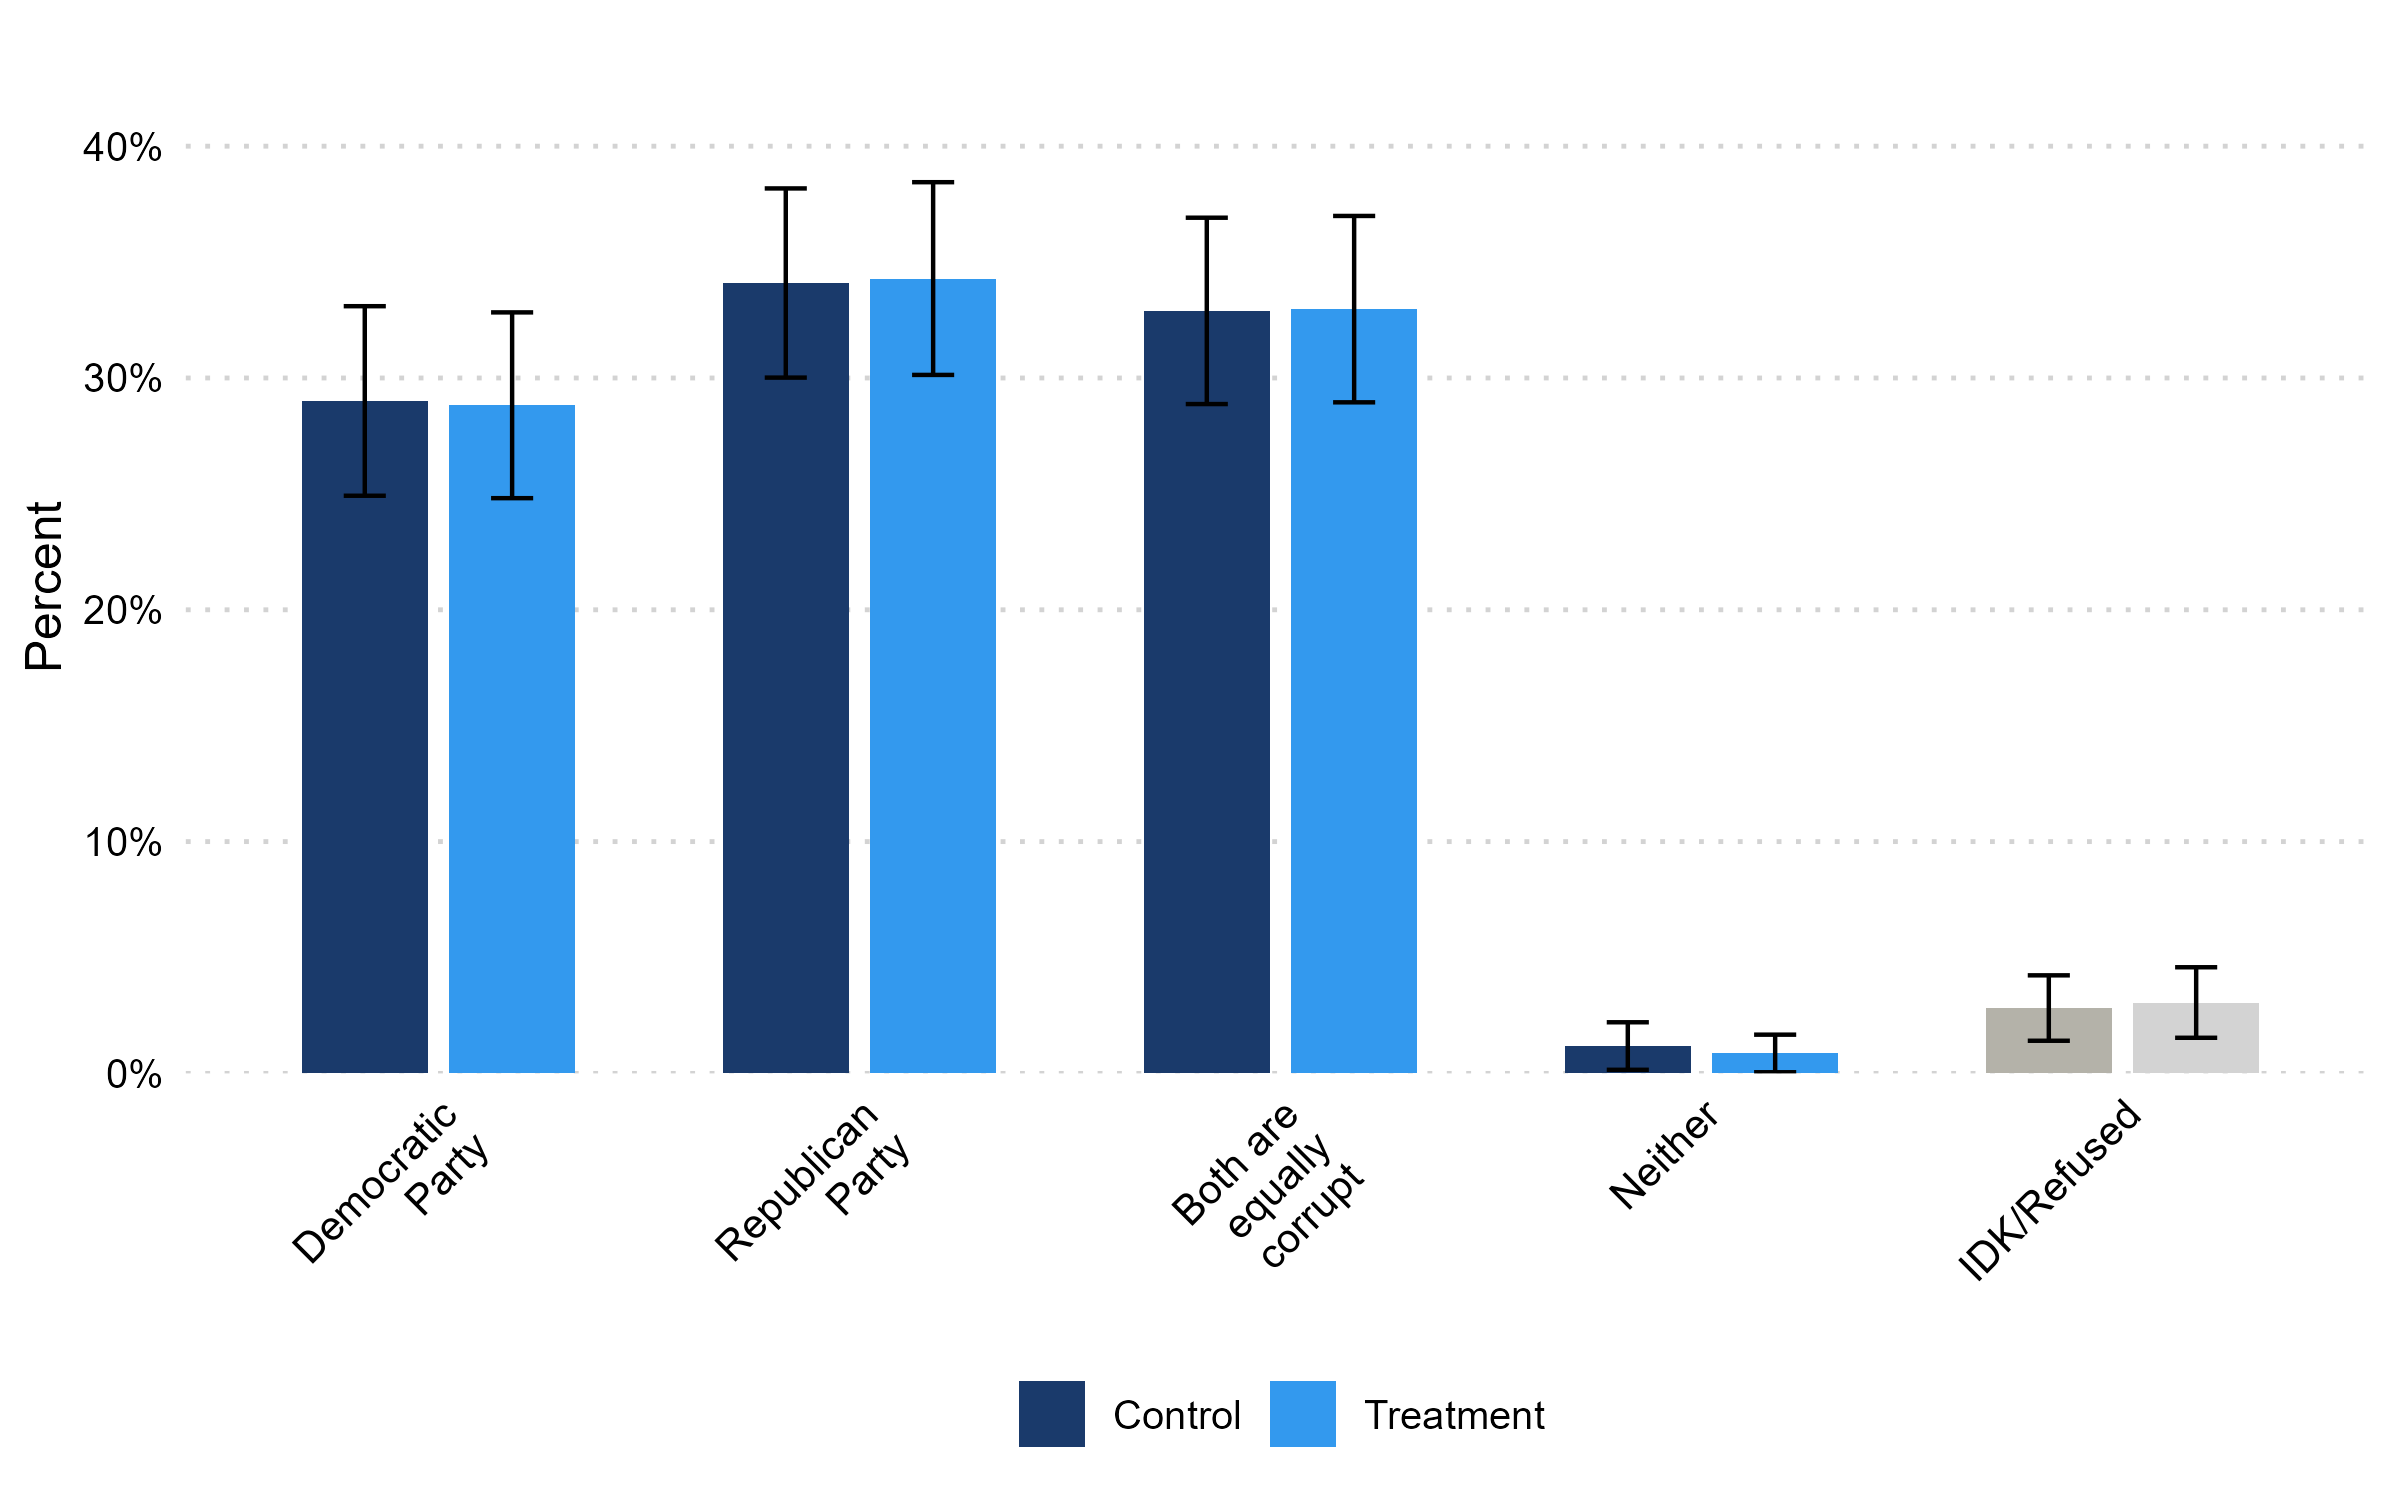
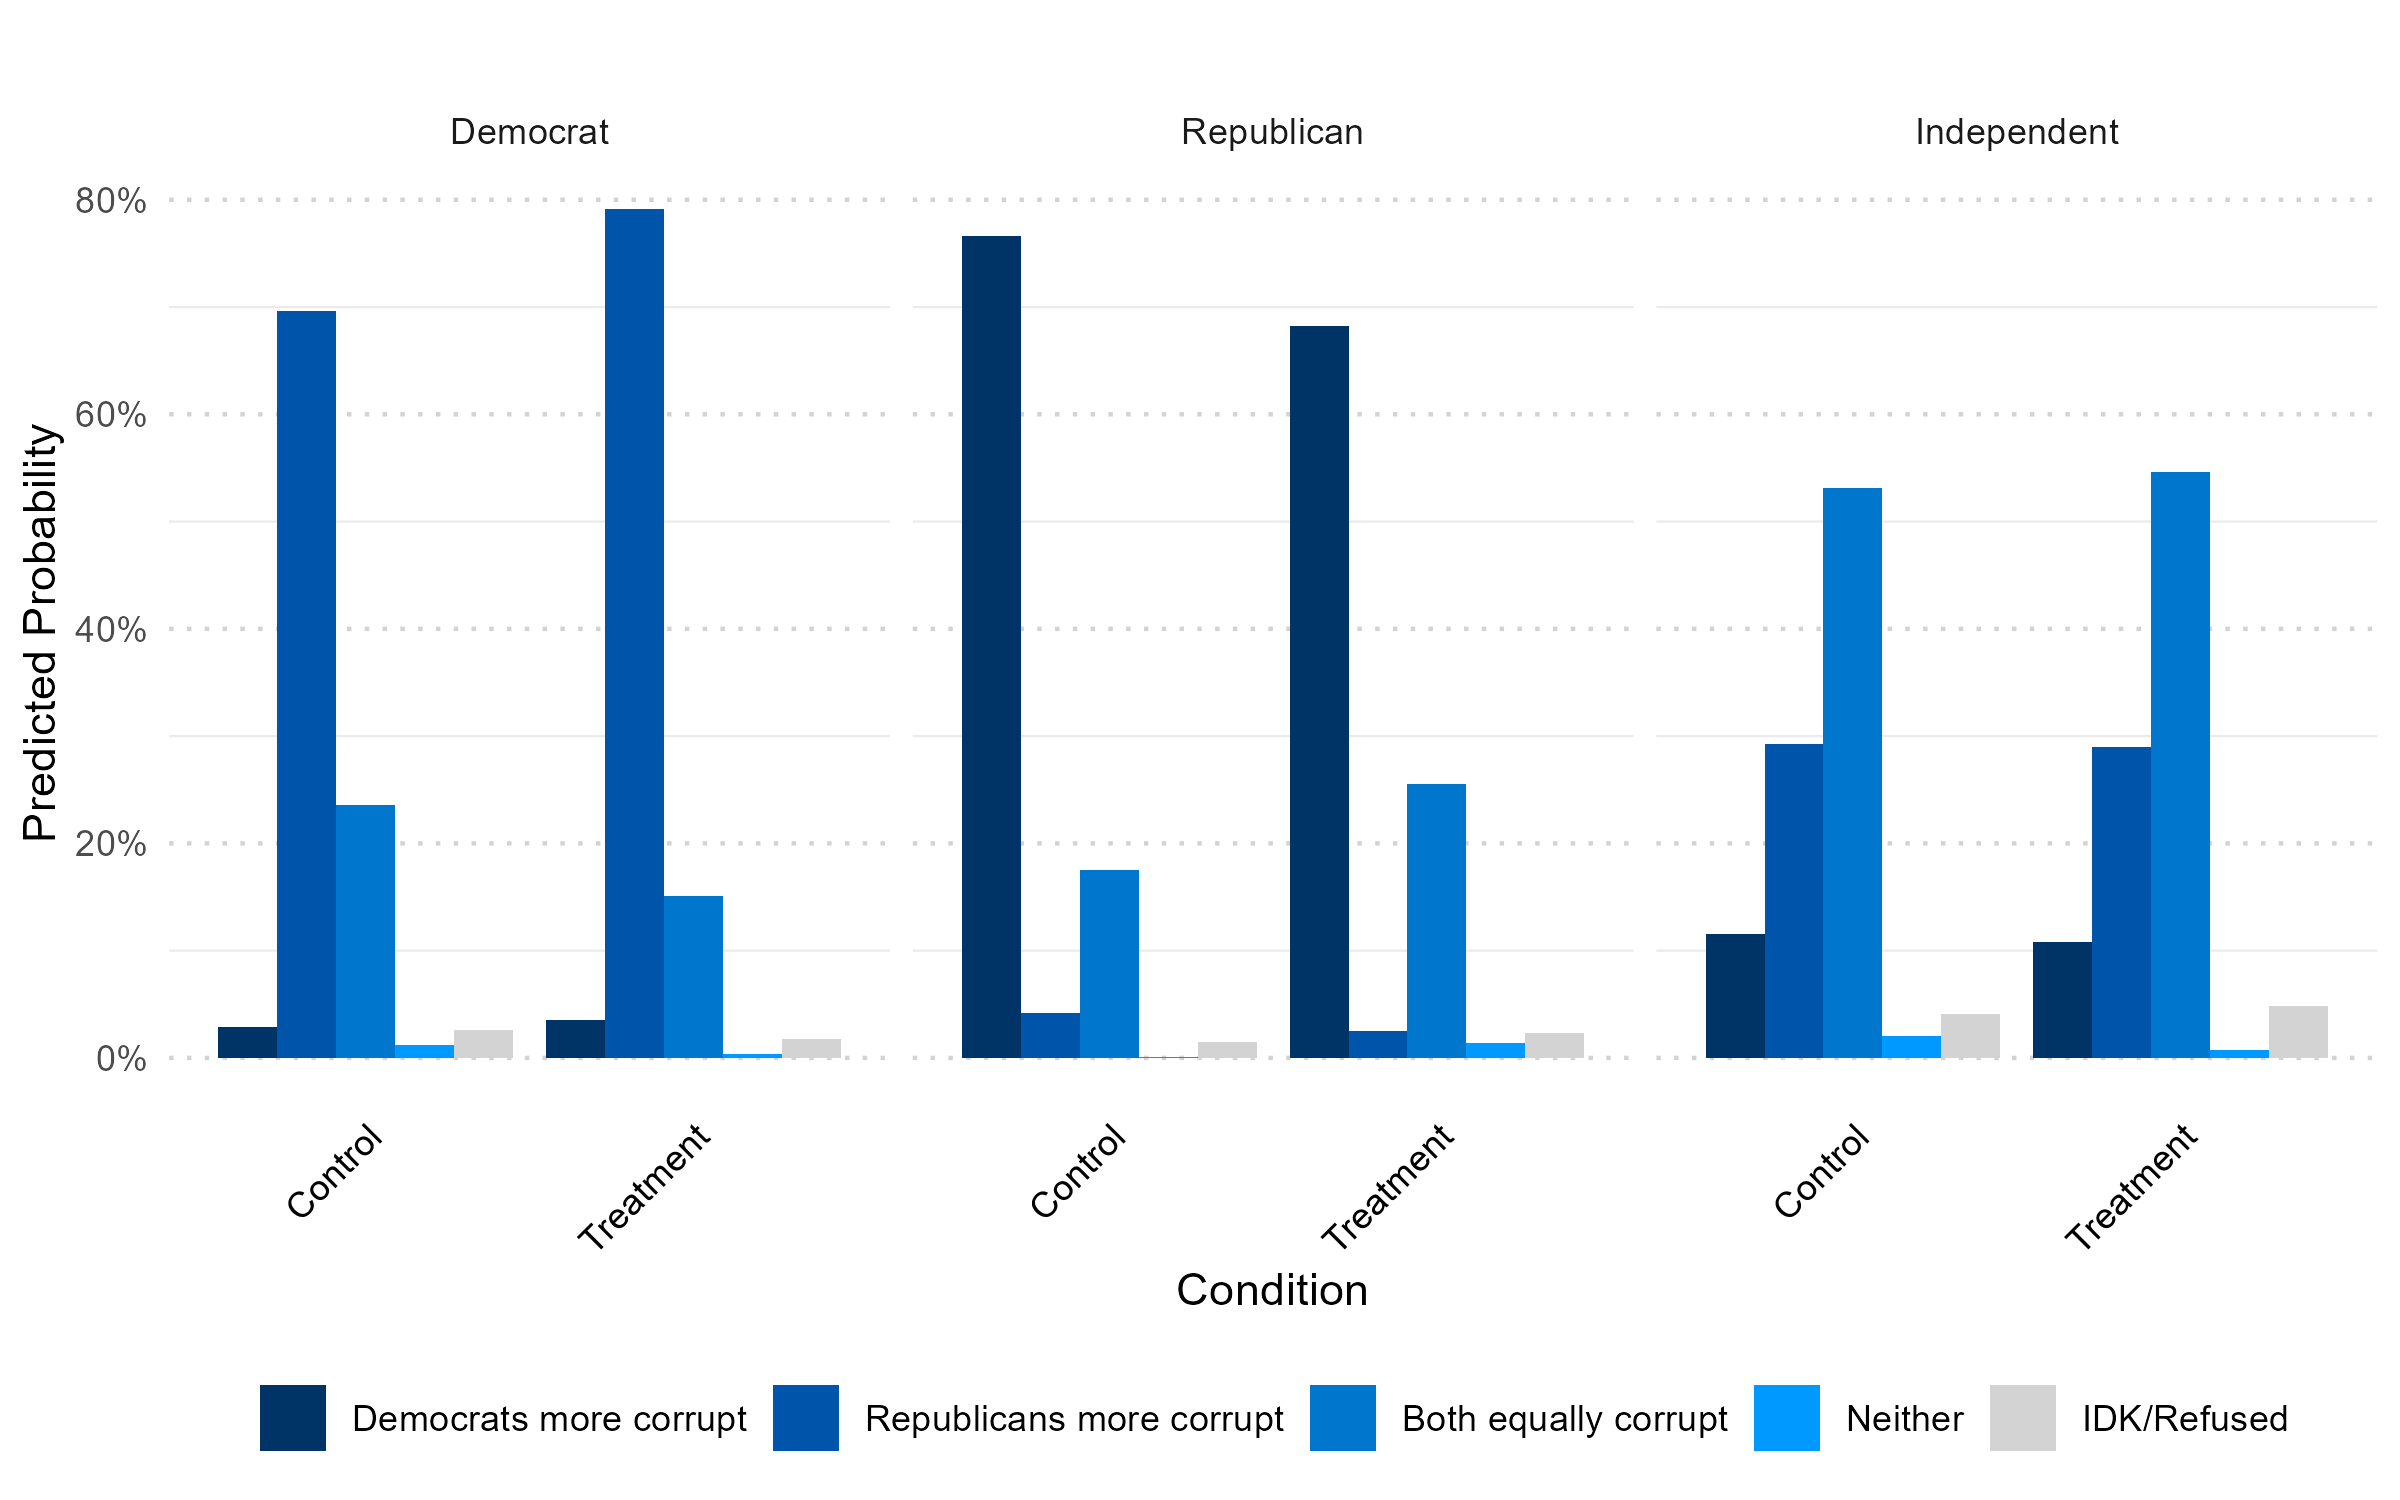
The average result is a truly null effect, with respondents reporting equal views of the parties across conditions. Disaggregating by party, there is some directional suggestion of movement, such that Democrats become more likely to say Republicans were more corrupt and less likely to say the parties were equally corrupt, while Republicans became less likely to say Democrats are more corrupt and more likely to say both parties were equally corrupt. These effects – in the 8-9 percentage point range – are both marginally statistically significant in this sample (p<0.1), though they somewhat offset one another (increase in “both equally corrupt” among Republicans but decrease among Democrats), yielding the overall null result. Unlike the survey experiment about corruption on the prior poll, there is no effect of note among independents.
Perceptions of Party Corruption by Experimental Condition and Respondent Party
Experimental Cartography
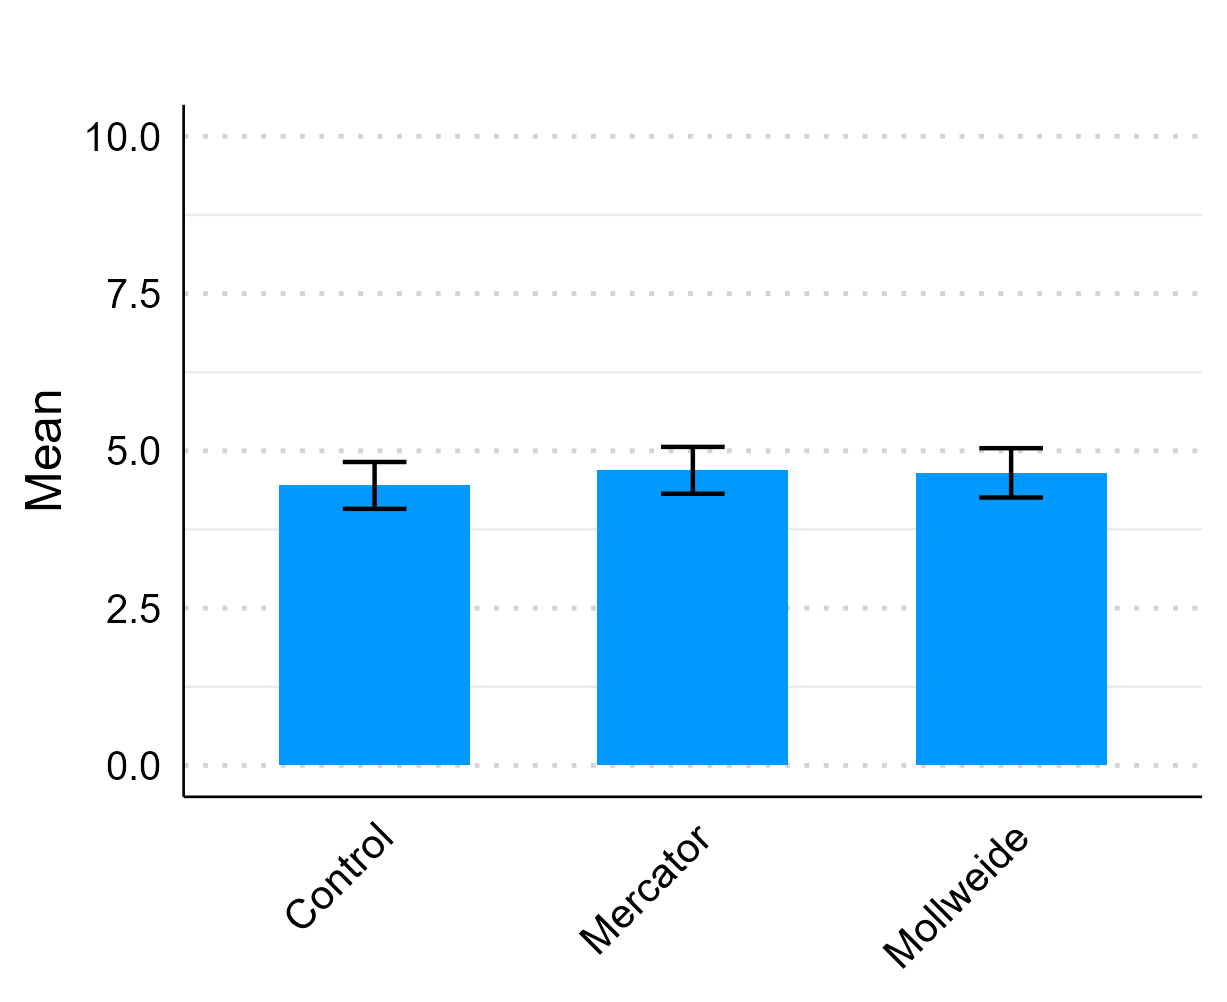
We conducted an additional experiment in this survey. Some have speculated that the importance placed on Greenland earlier this year by the current administration is a reflection of cartographic choices, namely the exaggerated size that Greenland appears on maps using the Mercator Projection, an idea at least as old as this West Wing episode. While we cannot evaluate the effect of this map distortion on decision making in the White House, we can use survey experiments to evaluate the effect of this map on survey respondents more generally. To test this hypothesis, we asked respondents the following question: “On a scale of 0 to 10, how important do you believe Greenland is to the national security interests of the United States?”
For one-third of respondents, the control group, they saw only this question without an image. The other two-thirds of respondents were evenly divided between two experimental conditions. The first saw, above the question, a map using the Mercator Projection with Greenland highlighted. The second saw a similar image, but using the Mollweide Projection. This projection distorts some angles, but keeps area constant, such that land masses closer to the poles do not appear larger than they are in reality.
Mercator Projection with Greenland Highlighted in Red.

Mollweide Projection with Greenland Highlighted in Red.

We found no statistically significant differences across conditions, and in particular the estimates between the two map conditions were close to identical. While we cannot offer insight into thinking at the White House, this study pours cold water on the idea that exaggerated size correlates perceptions of importance to U.S. national security interests.
Perceived Importance of Greenland to US National Security Interests
by Treatment Condition
Crosstabs
|
Topline
|
Party ID
|
Race
|
Gender
|
Education
|
Age Group
|
Region
|
2024 Vote
|
||||||||||||||||||||
|---|---|---|---|---|---|---|---|---|---|---|---|---|---|---|---|---|---|---|---|---|---|---|---|---|---|---|---|
| Overall | Democrat | Republican | Independent | Other Party | White | Black | Hispanic | AAPI | Other Race | Man | Woman | Some other way | College | Non-college | 18-29 | 30-44 | 45-64 | 65+ | Northeast | Midwest | South | West | Harris | Trump | Other | Didn't Vote | |
| Do you think things in The United States are generally going in the right direction or the wrong direction? | |||||||||||||||||||||||||||
| Right direction | 35 | 3 | 82 | 23 | 10 | 39 | 14 | 33 | 36 | 25 | 43 | 29 | 9 | 31 | 37 | 15 | 28 | 40 | 46 | 34 | 33 | 38 | 34 | 3 | 79 | 19 | 7 |
| Wrong direction | 60 | 94 | 14 | 73 | 80 | 56 | 81 | 64 | 64 | 63 | 53 | 66 | 88 | 66 | 57 | 78 | 68 | 55 | 51 | 62 | 62 | 58 | 62 | 95 | 17 | 70 | 77 |
| IDK/Refused | 4 | 3 | 4 | 4 | 10 | 5 | 5 | 3 | NA | 11 | 4 | 5 | 2 | 2 | 6 | 7 | 4 | 5 | 3 | 4 | 5 | 5 | 4 | 2 | 4 | 11 | 16 |
| Do you approve or disapprove of the way Donald Trump is handling his job as president? | |||||||||||||||||||||||||||
| Strongly approve | 26 | 0 | 66 | 13 | 8 | 30 | 11 | 23 | 20 | 18 | 29 | 24 | 9 | 21 | 29 | 7 | 16 | 31 | 38 | 22 | 22 | 32 | 23 | 1 | 62 | 7 | 4 |
| Somewhat approve | 12 | 0 | 24 | 12 | 10 | 14 | 4 | 10 | 22 | 17 | 15 | 10 | NA | 11 | 13 | 12 | 14 | 12 | 12 | 12 | 13 | 10 | 16 | 1 | 24 | 12 | 13 |
| Somewhat disapprove | 6 | 5 | 4 | 8 | 9 | 6 | 3 | 8 | 2 | 8 | 8 | 4 | 2 | 7 | 5 | 8 | 7 | 6 | 3 | 8 | 6 | 5 | 4 | 5 | 5 | 20 | 8 |
| Strongly disapprove | 53 | 93 | 5 | 65 | 63 | 49 | 76 | 57 | 56 | 47 | 46 | 59 | 88 | 60 | 50 | 67 | 60 | 49 | 46 | 55 | 56 | 50 | 56 | 93 | 8 | 56 | 62 |
| IDK/Refused | 2 | 2 | 1 | 2 | 10 | 2 | 6 | 2 | NA | 9 | 2 | 3 | 1 | 1 | 3 | 5 | 3 | 2 | 0 | 2 | 3 | 3 | 1 | 1 | 1 | 5 | 13 |
| Total approve | 38 | 1 | 90 | 24 | 18 | 43 | 16 | 32 | 42 | 35 | 44 | 34 | 9 | 32 | 42 | 20 | 30 | 43 | 50 | 34 | 35 | 42 | 38 | 1 | 87 | 19 | 17 |
| Total disapprove | 59 | 98 | 9 | 74 | 72 | 55 | 79 | 65 | 58 | 56 | 54 | 64 | 90 | 67 | 55 | 75 | 67 | 55 | 50 | 63 | 62 | 55 | 61 | 98 | 12 | 76 | 70 |
| If the 2026 election for US Congress were held today, would you support the Democratic candidate or the Republican candidate on the ballot? | |||||||||||||||||||||||||||
| Democratic Candidate | 48 | 93 | 3 | 53 | 43 | 43 | 72 | 52 | 46 | 39 | 41 | 52 | 88 | 55 | 43 | 58 | 52 | 45 | 42 | 47 | 49 | 46 | 50 | 91 | 3 | 37 | 40 |
| Republican Candidate | 38 | 1 | 92 | 21 | 15 | 43 | 14 | 33 | 42 | 30 | 44 | 32 | 11 | 31 | 41 | 22 | 30 | 41 | 48 | 32 | 38 | 41 | 35 | 1 | 88 | 14 | 11 |
| IDK/Refused | 13 | 4 | 3 | 25 | 42 | 13 | 14 | 13 | 12 | 31 | 12 | 14 | 1 | 10 | 15 | 20 | 17 | 13 | 6 | 19 | 12 | 11 | 13 | 7 | 7 | 39 | 49 |
| [Ban Congressional Stock Trading Act info] Do you approve or disapprove of this proposed law? | |||||||||||||||||||||||||||
| Strongly approve | 64 | 65 | 62 | 68 | 60 | 66 | 61 | 61 | 56 | 63 | 70 | 58 | 72 | 71 | 60 | 55 | 64 | 66 | 68 | 64 | 58 | 67 | 66 | 70 | 63 | 69 | 44 |
| Somewhat approve | 19 | 19 | 20 | 16 | 19 | 19 | 18 | 16 | 26 | 15 | 17 | 20 | 22 | 16 | 20 | 24 | 20 | 16 | 18 | 14 | 25 | 17 | 20 | 16 | 20 | 16 | 23 |
| Somewhat disapprove | 4 | 7 | 4 | 4 | 0 | 4 | 6 | 7 | 4 | 2 | 3 | 6 | 2 | 4 | 5 | 6 | 4 | 4 | 4 | 7 | 4 | 4 | 5 | 6 | 3 | 2 | 5 |
| Strongly disapprove | 5 | 3 | 6 | 5 | 3 | 4 | 5 | 6 | 12 | 10 | 4 | 6 | 2 | 3 | 6 | 5 | 2 | 6 | 6 | 7 | 4 | 4 | 4 | 3 | 6 | 3 | 9 |
| IDK/Refused | 8 | 5 | 8 | 6 | 18 | 7 | 9 | 10 | 2 | 10 | 5 | 10 | 1 | 5 | 9 | 10 | 10 | 8 | 5 | 8 | 8 | 9 | 5 | 5 | 7 | 9 | 19 |
| Who do you think is more corrupt? | |||||||||||||||||||||||||||
| Democratic Party | 29 | 3 | 72 | 13 | 7 | 32 | 13 | 27 | 20 | 25 | 33 | 26 | 7 | 24 | 32 | 13 | 20 | 33 | 40 | 24 | 23 | 34 | 30 | 3 | 66 | 5 | 9 |
| Republican Party | 34 | 74 | 3 | 32 | 22 | 32 | 49 | 35 | 25 | 26 | 31 | 37 | 46 | 38 | 32 | 39 | 35 | 31 | 35 | 36 | 38 | 31 | 35 | 66 | 3 | 16 | 26 |
| Both are equally corrupt | 33 | 19 | 22 | 51 | 60 | 32 | 30 | 36 | 48 | 43 | 33 | 32 | 38 | 34 | 32 | 47 | 39 | 31 | 21 | 36 | 35 | 31 | 33 | 27 | 29 | 73 | 55 |
| Neither | 1 | 1 | 1 | 1 | 1 | 0 | 4 | 1 | NA | NA | 1 | 1 | 6 | 1 | 1 | 1 | 2 | 1 | 1 | 0 | 1 | 2 | 1 | 1 | 1 | NA | 3 |
| IDK/Refused | 3 | 2 | 2 | 2 | 9 | 3 | 4 | 2 | 6 | 6 | 2 | 3 | 4 | 2 | 3 | NA | 4 | 3 | 2 | 4 | 3 | 3 | 2 | 3 | 2 | 2 | 8 |
| Do you describe yourself as a man, a woman, or in some other way? | |||||||||||||||||||||||||||
| Man | 47 | 35 | 52 | 53 | 46 | 45 | 42 | 54 | 66 | 53 | 100 | NA | NA | 47 | 46 | 53 | 53 | 44 | 40 | 46 | 44 | 45 | 53 | 39 | 55 | 62 | 40 |
| Woman | 52 | 64 | 47 | 46 | 48 | 53 | 58 | 46 | 34 | 44 | NA | 100 | NA | 52 | 52 | 44 | 44 | 55 | 60 | 53 | 54 | 54 | 46 | 59 | 45 | 38 | 58 |
| Some other way | 1 | 1 | 0 | 1 | 6 | 2 | NA | NA | NA | 3 | NA | NA | 100 | 1 | 1 | 3 | 3 | 0 | 0 | 1 | 2 | 1 | 1 | 2 | 0 | 0 | 2 |
| Which of the following best describes your race and ethnic background? | |||||||||||||||||||||||||||
| African-American or Black | 11 | 20 | 4 | 10 | 10 | NA | 100 | NA | NA | NA | 10 | 13 | NA | 13 | 10 | 14 | 11 | 14 | 6 | 7 | 12 | 16 | 7 | 18 | 4 | 8 | 13 |
| Asian-American, South-Asian, or Pacific Islander | 1 | 1 | 1 | 1 | 1 | NA | NA | NA | 100 | NA | 1 | 0 | NA | 1 | 1 | 1 | 1 | 1 | 0 | 0 | 1 | 0 | 2 | 0 | 1 | 2 | 2 |
| Hispanic or Latino | 15 | 19 | 13 | 14 | 16 | NA | NA | 100 | NA | NA | 18 | 14 | NA | 12 | 17 | 28 | 22 | 14 | 5 | 13 | 4 | 16 | 27 | 15 | 14 | 18 | 23 |
| Native American | 0 | 0 | 0 | 1 | 0 | NA | NA | NA | NA | 19 | 0 | 0 | NA | 0 | 0 | 0 | 0 | 0 | 0 | 0 | 1 | 0 | 0 | 0 | 0 | 1 | 1 |
| White or Caucasian | 70 | 59 | 81 | 71 | 69 | 100 | NA | NA | NA | NA | 68 | 72 | 95 | 72 | 69 | 56 | 64 | 69 | 86 | 78 | 81 | 66 | 61 | 65 | 80 | 67 | 59 |
| More than one of the above | 1 | 1 | 0 | 2 | 1 | NA | NA | NA | NA | 51 | 1 | 1 | 2 | 1 | 1 | 1 | 1 | 1 | 1 | 0 | 1 | 1 | 2 | 1 | 1 | 2 | 2 |
| Other | 1 | 0 | 0 | 1 | 2 | NA | NA | NA | NA | 30 | 1 | 0 | 3 | 0 | 1 | 0 | 1 | 0 | 1 | 1 | 1 | 0 | 1 | 0 | 1 | 3 | 0 |
| What is the last year of education or degree you've finished? | |||||||||||||||||||||||||||
| 1st through 11th grade | 2 | 2 | 2 | 1 | 2 | 2 | 4 | 0 | NA | 1 | 1 | 2 | NA | NA | 3 | 3 | 0 | 2 | 2 | 3 | 3 | 1 | 1 | 2 | 2 | NA | 3 |
| High School degree or GED | 18 | 15 | 21 | 18 | 19 | 19 | 14 | 18 | 15 | 23 | 20 | 16 | 8 | NA | 29 | 33 | 18 | 13 | 16 | 18 | 17 | 20 | 16 | 13 | 19 | 10 | 36 |
| Technical or vocational school | 7 | 5 | 10 | 6 | 8 | 7 | 2 | 11 | NA | 8 | 8 | 5 | 18 | NA | 11 | 4 | 7 | 9 | 6 | 7 | 6 | 7 | 7 | 5 | 10 | 0 | 6 |
| Some college but no degree | 24 | 24 | 24 | 22 | 30 | 24 | 23 | 25 | 31 | 20 | 23 | 25 | 25 | NA | 38 | 29 | 24 | 21 | 24 | 22 | 22 | 23 | 28 | 22 | 24 | 26 | 27 |
| Associate's (2 year) degree | 12 | 12 | 11 | 15 | 11 | 11 | 15 | 17 | 11 | 16 | 10 | 15 | 17 | NA | 20 | 12 | 11 | 15 | 12 | 9 | 13 | 14 | 13 | 13 | 13 | 12 | 11 |
| Bachelor's (4 year) degree | 22 | 24 | 21 | 25 | 19 | 23 | 21 | 21 | 13 | 18 | 25 | 21 | 14 | 61 | NA | 16 | 24 | 23 | 23 | 24 | 24 | 21 | 22 | 26 | 21 | 28 | 11 |
| Graduate or professional degree | 14 | 19 | 12 | 13 | 13 | 15 | 21 | 8 | 30 | 14 | 13 | 16 | 18 | 39 | NA | 3 | 16 | 16 | 18 | 18 | 15 | 13 | 13 | 19 | 11 | 23 | 7 |
| In the 2024 election for US President, for whom did you vote? | |||||||||||||||||||||||||||
| Kamala Harris | 44 | 87 | 3 | 49 | 39 | 41 | 70 | 42 | 26 | 37 | 37 | 50 | 74 | 54 | 38 | 44 | 48 | 43 | 42 | 45 | 46 | 42 | 44 | 100 | NA | NA | NA |
| Donald Trump | 40 | 3 | 93 | 26 | 17 | 46 | 15 | 36 | 36 | 33 | 48 | 35 | 9 | 34 | 44 | 21 | 33 | 45 | 51 | 39 | 37 | 44 | 38 | NA | 100 | NA | NA |
| Chase Oliver | 1 | 0 | 0 | 2 | 2 | 1 | NA | 1 | 4 | 1 | 1 | 1 | NA | 1 | 0 | 1 | 1 | 1 | 0 | 0 | 1 | 0 | 2 | NA | NA | 19 | NA |
| Jill Stein | 4 | 1 | 1 | 8 | 7 | 3 | 3 | 4 | 6 | 11 | 4 | 2 | 1 | 5 | 3 | 2 | 4 | 3 | 5 | 3 | 5 | 3 | 4 | NA | NA | 81 | NA |
| Did not vote for President | 9 | 6 | 2 | 14 | 30 | 8 | 10 | 14 | 25 | 15 | 8 | 10 | 16 | 5 | 12 | 18 | 14 | 8 | 2 | 11 | 9 | 9 | 8 | NA | NA | NA | 81 |
| Was not eligible to vote for President | 2 | 4 | 1 | 1 | 5 | 2 | 3 | 3 | 3 | 2 | 2 | 3 | NA | 0 | 4 | 14 | 0 | 0 | NA | 2 | 2 | 1 | 4 | NA | NA | NA | 19 |
| And today, when it comes to politics, do you think of yourself as more of a... | |||||||||||||||||||||||||||
| Democrat | 30 | 100 | NA | NA | NA | 25 | 53 | 38 | 22 | 24 | 23 | 37 | 23 | 35 | 28 | 41 | 29 | 28 | 28 | 28 | 34 | 27 | 34 | 60 | 2 | 9 | 24 |
| Independent | 26 | NA | NA | 100 | NA | 26 | 24 | 25 | 26 | 45 | 30 | 23 | 18 | 27 | 26 | 20 | 29 | 29 | 23 | 30 | 25 | 26 | 25 | 29 | 17 | 60 | 35 |
| Republican | 33 | NA | 100 | NA | NA | 38 | 13 | 27 | 38 | 11 | 37 | 30 | 9 | 29 | 35 | 18 | 26 | 35 | 45 | 29 | 28 | 38 | 33 | 2 | 76 | 10 | 8 |
| Something else | 7 | NA | NA | NA | 62 | 8 | 3 | 4 | 5 | 14 | 8 | 4 | 44 | 6 | 7 | 12 | 10 | 5 | 2 | 8 | 8 | 5 | 6 | 7 | 3 | 19 | 13 |
| Unsure | 4 | NA | NA | NA | 38 | 3 | 6 | 7 | 9 | 5 | 3 | 5 | 6 | 3 | 5 | 9 | 6 | 3 | 1 | 5 | 5 | 4 | 2 | 3 | 1 | 2 | 20 |
| Would you call yourself a strong Democrat or a not very strong Democrat? | |||||||||||||||||||||||||||
| Not very strong Democrat | 10 | 32 | NA | NA | NA | 8 | 10 | 17 | 10 | 9 | 7 | 12 | 11 | 10 | 9 | 19 | 10 | 7 | 7 | 9 | 14 | 7 | 12 | 17 | 1 | 6 | 12 |
| Strong Democrat | 21 | 68 | NA | NA | NA | 17 | 43 | 21 | 12 | 15 | 16 | 25 | 12 | 25 | 18 | 22 | 19 | 21 | 21 | 20 | 20 | 21 | 22 | 43 | 1 | 3 | 12 |
| Would you call yourself a strong Republican or a not very strong Republican? | |||||||||||||||||||||||||||
| Not very strong Republican | 7 | NA | 21 | NA | NA | 8 | 3 | 5 | 20 | 2 | 10 | 4 | 9 | 8 | 6 | 6 | 6 | 6 | 8 | 4 | 6 | 7 | 10 | 1 | 14 | 6 | 4 |
| Strong Republican | 26 | NA | 79 | NA | NA | 30 | 10 | 22 | 17 | 9 | 27 | 26 | NA | 21 | 29 | 12 | 19 | 29 | 36 | 26 | 23 | 30 | 23 | 0 | 63 | 5 | 4 |
| Do you generally think of yourself as closer to... | |||||||||||||||||||||||||||
| The Democratic Party | 10 | 1 | NA | 39 | NA | 11 | 12 | 5 | 5 | 9 | 10 | 11 | 0 | 12 | 9 | 7 | 12 | 11 | 10 | 10 | 10 | 12 | 9 | 21 | 0 | 12 | 4 |
| The Republican Party | 6 | NA | NA | 24 | NA | 7 | 3 | 5 | 5 | 10 | 9 | 4 | NA | 5 | 7 | 5 | 4 | 9 | 6 | 7 | 6 | 7 | 4 | 1 | 11 | 9 | 9 |
| Neither | 9 | NA | NA | 35 | NA | 7 | 10 | 14 | 16 | 25 | 10 | 8 | 18 | 9 | 9 | 8 | 11 | 9 | 7 | 12 | 9 | 6 | 12 | 8 | 5 | 37 | 18 |
| Unsure | 1 | NA | NA | 2 | NA | 1 | NA | NA | NA | 2 | 0 | 1 | NA | 1 | 1 | NA | 1 | 1 | 1 | 0 | 0 | 1 | 1 | 0 | 0 | 1 | 3 |
| How often do you pay attention to what's going on in government and politics? All the time, most of the time, about half the time, once in a while, or never | |||||||||||||||||||||||||||
| All the time | 40 | 45 | 41 | 39 | 27 | 41 | 41 | 39 | 33 | 30 | 42 | 39 | 38 | 46 | 37 | 29 | 36 | 44 | 45 | 37 | 35 | 44 | 41 | 47 | 40 | 24 | 24 |
| Most of the time | 36 | 32 | 40 | 38 | 29 | 36 | 35 | 35 | 24 | 44 | 38 | 34 | 26 | 34 | 37 | 34 | 37 | 35 | 38 | 34 | 40 | 34 | 38 | 35 | 40 | 35 | 24 |
| About half the time | 15 | 17 | 13 | 14 | 19 | 15 | 12 | 16 | 24 | 17 | 13 | 17 | 27 | 15 | 15 | 26 | 14 | 12 | 14 | 19 | 15 | 14 | 14 | 13 | 13 | 30 | 25 |
| Once in a while | 7 | 4 | 6 | 7 | 22 | 7 | 6 | 9 | 19 | 7 | 7 | 8 | 8 | 5 | 9 | 9 | 10 | 8 | 4 | 9 | 7 | 7 | 5 | 4 | 6 | 11 | 22 |
| Never | 1 | 1 | 1 | 1 | 4 | 1 | 6 | 0 | NA | 3 | 1 | 2 | 1 | 1 | 2 | 2 | 2 | 1 | NA | 0 | 2 | 1 | 2 | 1 | 1 | 0 | 5 |
| In the past 12 months, how often did you discuss political, societal, or local issues with friends or family? | |||||||||||||||||||||||||||
| Basically every day | 33 | 39 | 30 | 33 | 24 | 34 | 38 | 24 | 14 | 30 | 31 | 34 | 54 | 39 | 29 | 24 | 31 | 34 | 38 | 30 | 31 | 37 | 30 | 41 | 30 | 22 | 15 |
| A few times a week | 37 | 34 | 39 | 38 | 36 | 36 | 38 | 40 | 41 | 36 | 38 | 36 | 24 | 36 | 38 | 48 | 35 | 38 | 33 | 34 | 38 | 34 | 42 | 37 | 37 | 32 | 39 |
| A few times a month | 14 | 14 | 16 | 13 | 13 | 14 | 11 | 15 | 24 | 16 | 15 | 14 | NA | 14 | 14 | 14 | 16 | 12 | 15 | 13 | 14 | 16 | 13 | 12 | 16 | 21 | 15 |
| Once a month | 4 | 3 | 5 | 3 | 6 | 4 | 1 | 6 | NA | 3 | 5 | 4 | NA | 4 | 4 | 5 | 4 | 4 | 4 | 8 | 4 | 3 | 2 | 2 | 5 | 13 | 7 |
| Less than once a month | 7 | 5 | 7 | 6 | 12 | 7 | 4 | 8 | 19 | 4 | 6 | 7 | 16 | 5 | 8 | 6 | 8 | 5 | 7 | 10 | 6 | 6 | 6 | 5 | 7 | 10 | 10 |
| Not at all | 5 | 5 | 4 | 6 | 8 | 4 | 8 | 7 | 2 | 10 | 5 | 5 | 5 | 3 | 6 | 3 | 6 | 7 | 4 | 4 | 6 | 5 | 6 | 4 | 5 | 2 | 13 |
| How important is politics to your personal identity? | |||||||||||||||||||||||||||
| Extremely important | 14 | 18 | 14 | 10 | 8 | 14 | 14 | 14 | 19 | 13 | 14 | 13 | 31 | 14 | 13 | 11 | 15 | 12 | 16 | 12 | 13 | 16 | 11 | 17 | 12 | 11 | 9 |
| Very important | 24 | 31 | 23 | 18 | 23 | 24 | 28 | 24 | 14 | 17 | 22 | 26 | 23 | 24 | 24 | 28 | 21 | 23 | 26 | 21 | 27 | 24 | 25 | 28 | 21 | 20 | 20 |
| Somewhat important | 29 | 27 | 32 | 31 | 22 | 30 | 31 | 25 | 29 | 24 | 29 | 30 | 27 | 31 | 28 | 29 | 27 | 30 | 30 | 34 | 32 | 26 | 30 | 30 | 32 | 24 | 22 |
| Not too important | 21 | 18 | 20 | 24 | 22 | 20 | 17 | 24 | 25 | 22 | 23 | 19 | 8 | 21 | 21 | 21 | 21 | 23 | 18 | 22 | 17 | 22 | 22 | 18 | 22 | 26 | 24 |
| Not at all important | 10 | 4 | 8 | 15 | 18 | 10 | 6 | 10 | 12 | 21 | 10 | 10 | 9 | 8 | 11 | 8 | 13 | 10 | 7 | 9 | 11 | 9 | 11 | 6 | 11 | 17 | 20 |
| IDK/Refused | 2 | 1 | 2 | 1 | 7 | 2 | 4 | 2 | NA | 2 | 2 | 3 | 1 | 2 | 3 | 3 | 3 | 2 | 2 | 1 | 1 | 4 | 2 | 1 | 3 | 3 | 5 |
| Do you consider yourself to be a feminist? | |||||||||||||||||||||||||||
| Yes | 32 | 58 | 8 | 30 | 41 | 35 | 25 | 29 | 19 | 28 | 24 | 39 | 85 | 40 | 28 | 51 | 35 | 26 | 28 | 36 | 34 | 30 | 31 | 56 | 9 | 20 | 29 |
| No | 49 | 29 | 72 | 48 | 35 | 47 | 62 | 50 | 55 | 47 | 58 | 42 | NA | 44 | 52 | 33 | 48 | 55 | 51 | 44 | 51 | 48 | 52 | 29 | 72 | 47 | 46 |
| IDK/Refused | 18 | 13 | 19 | 21 | 24 | 18 | 13 | 21 | 25 | 25 | 18 | 19 | 15 | 16 | 20 | 16 | 16 | 19 | 21 | 20 | 14 | 21 | 16 | 15 | 19 | 31 | 24 |
| Age from voter file. | |||||||||||||||||||||||||||
| 18-29 | 14 | 19 | 8 | 11 | 27 | 11 | 17 | 25 | 15 | 14 | 16 | 12 | 30 | 7 | 18 | 14 | NA | NA | NA | 16 | 14 | 10 | 20 | 14 | 7 | 12 | 39 |
| 30-44 | 25 | 24 | 20 | 28 | 39 | 23 | 25 | 36 | 36 | 22 | 29 | 21 | 54 | 28 | 24 | NA | 25 | NA | NA | 22 | 28 | 25 | 26 | 28 | 21 | 27 | 32 |
| 45-64 | 33 | 31 | 35 | 37 | 25 | 32 | 42 | 30 | 35 | 35 | 32 | 35 | 13 | 35 | 32 | NA | NA | 33 | NA | 39 | 32 | 34 | 29 | 32 | 38 | 28 | 24 |
| 65+ | 27 | 25 | 37 | 24 | 10 | 33 | 15 | 9 | 14 | 29 | 23 | 31 | 2 | 30 | 26 | NA | NA | NA | 27 | 23 | 27 | 30 | 25 | 26 | 34 | 32 | 5 |
| Region from voter file. | |||||||||||||||||||||||||||
| Northeast | 18 | 17 | 16 | 21 | 22 | 20 | 11 | 16 | 12 | 11 | 18 | 19 | 13 | 21 | 17 | 20 | 16 | 21 | 16 | 18 | NA | NA | NA | 19 | 18 | 14 | 21 |
| Midwest | 22 | 24 | 19 | 21 | 26 | 25 | 23 | 6 | 18 | 20 | 21 | 22 | 38 | 23 | 21 | 22 | 24 | 21 | 22 | NA | 22 | NA | NA | 23 | 20 | 28 | 21 |
| South | 38 | 34 | 43 | 37 | 35 | 36 | 52 | 40 | 24 | 35 | 37 | 40 | 36 | 36 | 40 | 28 | 38 | 39 | 43 | NA | NA | 38 | NA | 36 | 42 | 31 | 35 |
| West | 22 | 24 | 22 | 21 | 17 | 19 | 14 | 38 | 46 | 33 | 25 | 19 | 13 | 20 | 22 | 30 | 23 | 19 | 20 | NA | NA | NA | 22 | 22 | 21 | 27 | 23 |
Methodological Statement
Sampling
We sampled potential respondents from the L2 voter file of registered voters. The population was divided into 36 non-overlapping strata based on race, age, participation in the 2024 general election, party alignment, and educational attainment model category. This stratification schema was used to define a target number of completes for each stratum, sampled inversely proportional to expected response rates based on past surveys, oversampling to allow for variation from these expected response rates. After defining stratification and targets, we then limited the sample to records with cell-phones.
We supplemented this text-to-web survey with a sample of Rep Data panelists who had been matched to the voter file, to mitigate concerns over coverage of a cell-only sample and other mode-specific non-response biases. We then reconstructed which sampling strata these Rep Data panelists belonged to based on voter file data.
Fielding
The text-to-web and live interviewer surveys were fielded from Monday, March 9, 2026 through Sunday, March 15, 2026. The first day of fielding was a “soft launch” limiting the number of records. We then activated the DRASS sampling system to adjust for relative non-response across sampling strata. We also set quotas matching target numbers for the completed responses by strata, such that we did not initiate any new surveys to respondents from strata where the quotas had been met, but did not terminate respondents after their respective stratum-level quota had been met either.
The panel-to-web surveys were from a list of registered voter targets from Rep Data, who matched their panelists to the L2 voter file, limiting the respondents to those who were affirmatively matched. These panelists were then interviewed from Monday, March 9, 2026 through Sunday, March 15, 2026, with quotas in place matching the sample stratification targets. These responses were then matched back to the L2 file, appending the demographic necessary to reconstruct their sampling strata. We completed 498 interviews via panel-to-web fielding, for a combined mixed-mode sample of 1,547 interviews.
We checked to make sure there were no duplicate records between and within the samples, and discarded 1 record with duplicate voter records from the panel data. Post-deduplication, we had a total of 1,546 completed interviews.
Weighting
We first created base weights by rake weighting the text-to-web sample back to stratification benchmarks using fields associated with the respondents in the voter file. We then use these weights to estimate the frequency of survey taking, creating four bins (0, 1, 2, 3+). Then we rake weight the panel-to-web responses using both the distribution of strata and this binned estimate of survey response frequency to create base weights for the panel-to-web survey. Finally, with these base weights as starting values, we pool the data together and rake the combined sample to the strata distribution, survey response frequency, census region, race, educational attainment, gender using self-reports, and party affiliation using self-reports. Weighting targets for census region, race, educational attainment, gender, and party affiliation are derived from the Pew NPORS survey conducted January 2025. Weights were trimmed at the 5th and 95th percentiles.
After accounting for the Kish 1+L approximation of the design effect from weighting, the margin of error is 1.42 percentage points.
Other Disclosures
This survey of registered voters in the United States was paid for by Survey 160 as part of our ongoing methodological research initiatives. All estimates of public opinion have sources of error beyond that which is captured by the margin of error, including non-ignorable (post weighting) non-response error, frame and coverage error, measurement error and processing error.
Survey Instrument
First, do you think things in the United States are generally going in the right direction or the wrong direction?
[Rotate 1-2]
- Right direction
- Wrong direction
- No opinion
- Refused [Vol]
In a few words, what news story caught your attention this week?
"News" can be anything you follow, whether local TV, websites, podcasts, or social media, on any topic like sports, entertainment, or politics. We just want to know what caught your attention. If you can't think of anything specific, that's okay, just say so.
[Free response]
Do you approve or disapprove of the way Donald Trump is handling his job as president?
[Flip Order 1234 / 4321]
- Strongly approve
- Somewhat approve
- Somewhat disapprove
- Strongly disapprove
- No opinion
- Refused [Vol]
If the 2026 election for US Congress were held today, would you support the Democratic candidate or the Republican candidate on the ballot?
[Rotate 1-2]
- The Democratic Candidate
- The Republican Candidate
- No opinion
- Refused [Vol]
In 2025, Democratic Senator Jon Ossoff introduced a bill called the "Ban Congressional Stock Trading Act." This bill would stop members of Congress and their families from buying and selling stocks. Members of Congress often see private information that can change how the stock market performs. They also help create laws that affect certain businesses. Some people believe this means Congress members could use their jobs to make money unfairly through stock trading. However, others argue that this bill would wrongly keep Congress members and their families from investing their own money however they choose.
Do you approve or disapprove of this proposed law?
[Randomize order with Q6]
- Strongly approve
- Somewhat approve
- Somewhat disapprove
- Strongly disapprove
- No opinion
- Refused
Who do you think is more corrupt?
[Rotate 1-2]
- The Democratic Party
- The Republican Party
- Both are equally corrupt
- Neither
- No opinion
- Refused [Vol]
On a scale of 0 to 10, how important do you believe Greenland is to the national security interests of the United States?
[Randomly show only one of Q7a, Q7b, or Q7c]
On a scale of 0 to 10, how important do you believe Greenland is to the national security interests of the United States?
[Shows world map with Mercator Projection, Greenland highlighted]
On a scale of 0 to 10, how important do you believe Greenland is to the national security interests of the United States?
[Shows world map with Mollweide Projection, Greenland highlighted]
The next set of questions are for statistical purposes only.
Do you describe yourself as a man, woman, or in some other way?
- Man
- Woman
- Some other way
In what year were you born? Please respond with a four-digit year.
[Free response]
Which of the following best describes your race and ethnic background?
- African-American or Black
- Asian-American, South-Asian, or Pacific Islander
- Hispanic or Latino
- Native American
- White or Caucasian
- More than one of the above
- Other (please specify)
What is the last year of education or degree you've finished?
- 1st through 11th grade
- High School degree or GED
- Technical or vocational school
- Some college but no degree
- Associate's (2 year) degree
- Bachelor's (4 year) degree
- Graduate or professional degree
In the 2024 election for US President, for whom did you vote?
- Democrat Kamala Harris
- Republican Donald Trump
- Libertarian Chase Oliver
- Green Party candidate Jill Stein
- Some other candidate (please specify)
- Did not vote for President
- Was not eligible to vote for President
And today, when it comes to politics, do you think of yourself as more of a …
[Rotate 1-2]
- Democrat → Q14a
- Republican → Q14b
- Independent → Q14c
- Something else
- Unsure
Would you call yourself a strong Democrat or a not very strong Democrat?
- Strong Democrat
- Not very strong Democrat
Would you call yourself a strong Republican or a not very strong Republican?
- Strong Republican
- Not very strong Republican
Do you generally think of yourself as closer to …
- The Democratic Party
- The Republican Party
- Neither
- Unsure
How often do you pay attention to what's going on in government and politics?
- All the time
- Most of the time
- About half the time
- Once in a while
- Never
In the past 12 months, how often did you discuss political, societal, or local issues with friends or family?
- Basically every day
- A few times a week
- A few times a month
- Once a month
- Less than once a month
- Not at all
How important is politics to your personal identity?
- Extremely important
- Very important
- Somewhat important
- Not too important
- Not at all important
- No opinion
- Refused [Vol]
Do you consider yourself to be a feminist?
- Yes
- No
- No opinion
- Refused [Vol]
[Embargoed]
Sometimes, people answer multiple polls from different survey organizations. Besides this poll, how many polls have you answered in the last month? Please reply with a specific number, and if you cannot recall exactly, please just give your best guess.
[Free response, limited to integer]
Finally, last year, that is in 2024, what was your total family income from all sources, before taxes?
- Less than $30,000
- $30,000 to less than $40,000
- $40,000 to less than $50,000
- $50,000 to less than $70,000
- $70,000 to less than $100,000
- $100,000 to less than $125,000
- $125,000 to less than $150,000
- $150,000 or more